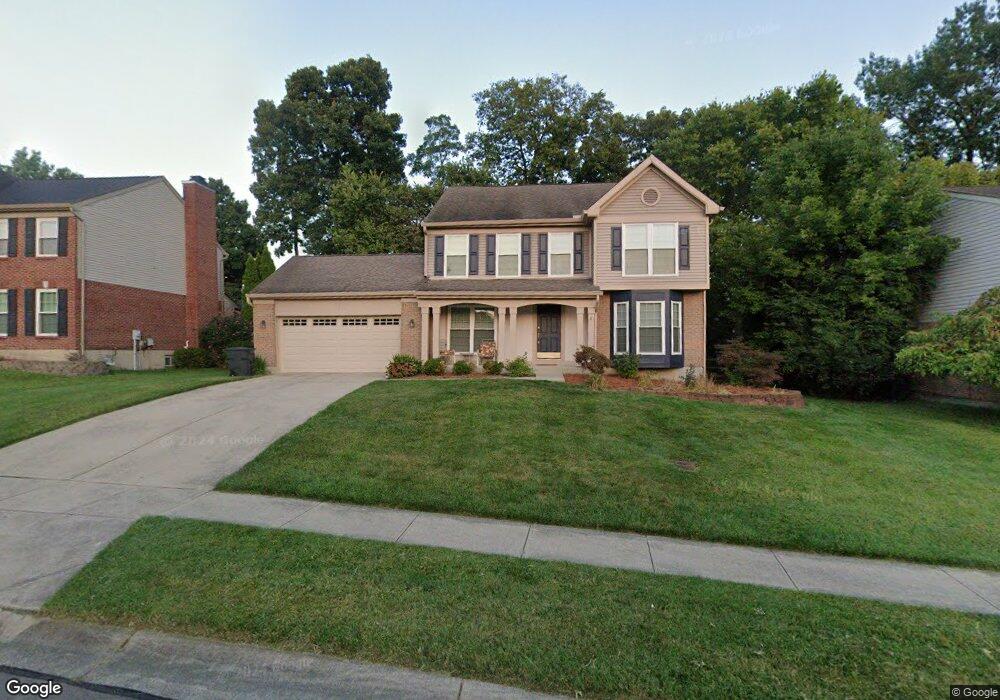
4195 Brandonmore Dr Cincinnati, OH 45255
Estimated Value: $402,165 - $441,000
4
Beds
3
Baths
2,248
Sq Ft
$190/Sq Ft
Est. Value
About This Home
This home is located at 4195 Brandonmore Dr, Cincinnati, OH 45255 and is currently estimated at $426,791, approximately $189 per square foot. 4195 Brandonmore Dr is a home located in Clermont County with nearby schools including Withamsville-Tobasco Elementary School, West Clermont Middle School, and West Clermont High School.
Ownership History
Date
Name
Owned For
Owner Type
Purchase Details
Closed on
May 14, 2004
Sold by
Lintz Robert C and Lintz Marianne
Bought by
Lynn Janet L
Current Estimated Value
Home Financials for this Owner
Home Financials are based on the most recent Mortgage that was taken out on this home.
Original Mortgage
$191,200
Outstanding Balance
$91,847
Interest Rate
5.85%
Mortgage Type
Purchase Money Mortgage
Estimated Equity
$334,944
Purchase Details
Closed on
Nov 21, 1994
Sold by
Drees Co
Bought by
Fraser Diane B and Fraser Kevin E
Home Financials for this Owner
Home Financials are based on the most recent Mortgage that was taken out on this home.
Original Mortgage
$165,850
Interest Rate
6.75%
Mortgage Type
New Conventional
Purchase Details
Closed on
Jul 13, 1994
Create a Home Valuation Report for This Property
The Home Valuation Report is an in-depth analysis detailing your home's value as well as a comparison with similar homes in the area
Purchase History
| Date | Buyer | Sale Price | Title Company |
|---|---|---|---|
| Lynn Janet L | $225,000 | Advanced Land Title Agency L | |
| Fraser Diane B | $174,420 | -- | |
| -- | $46,600 | -- |
Source: Public Records
Mortgage History
| Date | Status | Borrower | Loan Amount |
|---|---|---|---|
| Open | Lynn Janet L | $191,200 | |
| Previous Owner | Fraser Diane B | $165,850 |
Source: Public Records
Tax History
| Year | Tax Paid | Tax Assessment Tax Assessment Total Assessment is a certain percentage of the fair market value that is determined by local assessors to be the total taxable value of land and additions on the property. | Land | Improvement |
|---|---|---|---|---|
| 2024 | $5,194 | $101,400 | $20,300 | $81,100 |
| 2023 | $5,202 | $101,400 | $20,300 | $81,100 |
| 2022 | $4,975 | $84,000 | $16,800 | $67,200 |
| 2021 | $4,996 | $84,000 | $16,800 | $67,200 |
| 2020 | $5,000 | $84,000 | $16,800 | $67,200 |
| 2019 | $4,197 | $82,180 | $16,800 | $65,380 |
| 2018 | $4,239 | $82,180 | $16,800 | $65,380 |
| 2017 | $4,294 | $82,180 | $16,800 | $65,380 |
| 2016 | $3,910 | $68,500 | $14,000 | $54,500 |
| 2015 | $3,715 | $68,500 | $14,000 | $54,500 |
| 2014 | $3,715 | $68,500 | $14,000 | $54,500 |
| 2013 | $3,715 | $67,760 | $15,400 | $52,360 |
Source: Public Records
Map
Nearby Homes
- 4133 Brandonmore Dr
- 1747 Summithills Dr
- 8488 Holiday Hills Dr
- 0 Clough Pike Unit 1861584
- 4077 Mclean Dr
- 425 Mcintosh Dr Unit 22A
- 1847 Eight Mile Rd
- 4047 Mclean Dr
- 4182 Mount Carmel Tobasco Rd
- 1333 Eight Mile Rd
- 1472 Sigma Cir
- 8190 Bonanza Ln
- 1251 Eight Mile Rd
- 8345 Cherry Ln
- 496 Mapleleaf Dr
- 492 Mapleleaf Dr
- 537 Tradition Ridge
- 539 Tradition Ridge
- 535 Tradition Ridge
- 533 Tradition Ridge
- 4193 Brandonmore Dr
- 4197 Brandonmore Dr
- 4191 Brandonmore Dr
- 1726 Muskegon Dr
- 4199 Brandonmore Dr
- 1702 Muskegon Dr
- 4194 Brandonmore Dr
- 1714 Muskegon Dr
- 4198 Brandonmore Dr
- 4189 Brandonmore Dr
- 4192 Brandonmore Dr
- 1690 Muskegon Dr
- 1738 Muskegon Dr
- 4201 Brandonmore Dr
- 1678 Muskegon Dr
- 4200 Brandonmore Dr
- 4187 Brandonmore Dr
- 1750 Muskegon Dr
- 444 Ashsteade Ln
- 443 Ashsteade Ln
Your Personal Tour Guide
Ask me questions while you tour the home.