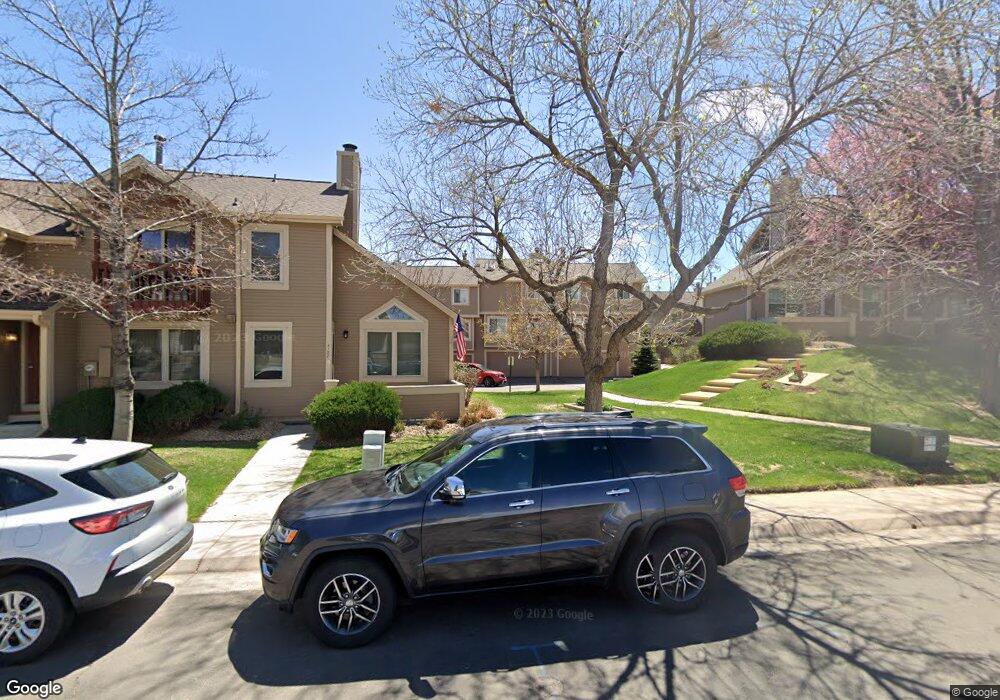
4196 S Mobile Cir Unit C Aurora, CO 80013
Mission Viejo NeighborhoodEstimated Value: $326,000 - $344,000
2
Beds
3
Baths
1,098
Sq Ft
$305/Sq Ft
Est. Value
About This Home
This home is located at 4196 S Mobile Cir Unit C, Aurora, CO 80013 and is currently estimated at $334,683, approximately $304 per square foot. 4196 S Mobile Cir Unit C is a home located in Arapahoe County with nearby schools including Mission Viejo Elementary School, Laredo Middle School, and Smoky Hill High School.
Ownership History
Date
Name
Owned For
Owner Type
Purchase Details
Closed on
Feb 14, 1997
Sold by
Johnson Kimberly and Johnson Kimberly
Bought by
Kim Hyun K
Current Estimated Value
Home Financials for this Owner
Home Financials are based on the most recent Mortgage that was taken out on this home.
Original Mortgage
$87,750
Outstanding Balance
$7,183
Interest Rate
6.12%
Estimated Equity
$327,500
Purchase Details
Closed on
Dec 29, 1994
Sold by
Olsen Christopher B
Bought by
Johnson Kimberly
Purchase Details
Closed on
Jun 30, 1988
Sold by
Secretary Of Housing & Urban Dev
Bought by
Olsen Chris B
Purchase Details
Closed on
Mar 10, 1988
Sold by
Home Mortgage Co Of El Paso
Bought by
Secretary Of Housing & Urban Dev
Purchase Details
Closed on
Feb 8, 1988
Sold by
Conversion Arapco
Bought by
Home Mortgage Co Of El Paso
Purchase Details
Closed on
Nov 1, 1984
Sold by
Conversion Arapco
Bought by
Conversion Arapco
Purchase Details
Closed on
Sep 1, 1983
Bought by
Conversion Arapco
Create a Home Valuation Report for This Property
The Home Valuation Report is an in-depth analysis detailing your home's value as well as a comparison with similar homes in the area
Home Values in the Area
Average Home Value in this Area
Purchase History
| Date | Buyer | Sale Price | Title Company |
|---|---|---|---|
| Kim Hyun K | $97,500 | -- | |
| Johnson Kimberly | -- | -- | |
| Olsen Chris B | -- | -- | |
| Secretary Of Housing & Urban Dev | -- | -- | |
| Home Mortgage Co Of El Paso | -- | -- | |
| Conversion Arapco | -- | -- | |
| Conversion Arapco | -- | -- |
Source: Public Records
Mortgage History
| Date | Status | Borrower | Loan Amount |
|---|---|---|---|
| Open | Kim Hyun K | $87,750 |
Source: Public Records
Tax History
| Year | Tax Paid | Tax Assessment Tax Assessment Total Assessment is a certain percentage of the fair market value that is determined by local assessors to be the total taxable value of land and additions on the property. | Land | Improvement |
|---|---|---|---|---|
| 2025 | $1,622 | $21,369 | -- | -- |
| 2024 | $1,430 | $20,670 | -- | -- |
| 2023 | $1,430 | $20,670 | $0 | $0 |
| 2022 | $1,342 | $18,529 | $0 | $0 |
| 2021 | $1,351 | $18,529 | $0 | $0 |
| 2020 | $1,385 | $19,291 | $0 | $0 |
| 2019 | $1,337 | $19,291 | $0 | $0 |
| 2018 | $1,043 | $14,148 | $0 | $0 |
| 2017 | $1,028 | $14,148 | $0 | $0 |
| 2016 | $932 | $12,020 | $0 | $0 |
| 2015 | $886 | $12,020 | $0 | $0 |
| 2014 | $699 | $8,398 | $0 | $0 |
| 2013 | -- | $11,130 | $0 | $0 |
Source: Public Records
Map
Nearby Homes
- 4106 S Laredo Way
- 4230 S Mobile Cir Unit B
- 4105 S Laredo Way
- 4148 S Lewiston Cir
- 4212 S Laredo Way
- 3955 S Nucla St
- 16812 E Mansfield Cir
- 15915 E Mercer Cir
- 16313 E Rice Place Unit B
- 17212 E Oberlin Place
- 3927 S Pitkin Way
- 16222 E Rice Place Unit B
- 4054 S Quintero Way
- 15922 E Rice Place Unit B
- 16229 E Stanford Place
- 16075 E Lehigh Cir
- 15993 E Loyola Dr
- 16796 E Kent Dr
- 15972 E Lehigh Cir
- 15583 E Quincy Place
- 4196 S Mobile Cir Unit A
- 4196 S Mobile Cir Unit B
- 4196 S Mobile Cir Unit D
- 4186 S Mobile Cir Unit A
- 4186 S Mobile Cir Unit B
- 4186 S Mobile Cir Unit C
- 4186 S Mobile Cir Unit D
- 4188 S Mobile Cir Unit D
- 4188 S Mobile Cir Unit C
- 4188 S Mobile Cir Unit B
- 4188 S Mobile Cir Unit A
- 4200 S Mobile Cir Unit A
- 4200 S Mobile Cir Unit B
- 4200 S Mobile Cir Unit C
- 4200 S Mobile Cir Unit D
- 4198 S Mobile Cir Unit D
- 4198 S Mobile Cir Unit C
- 4198 S Mobile Cir Unit B
- 4198 S Mobile Cir Unit A
- 4198 S Mobile Cir
Your Personal Tour Guide
Ask me questions while you tour the home.