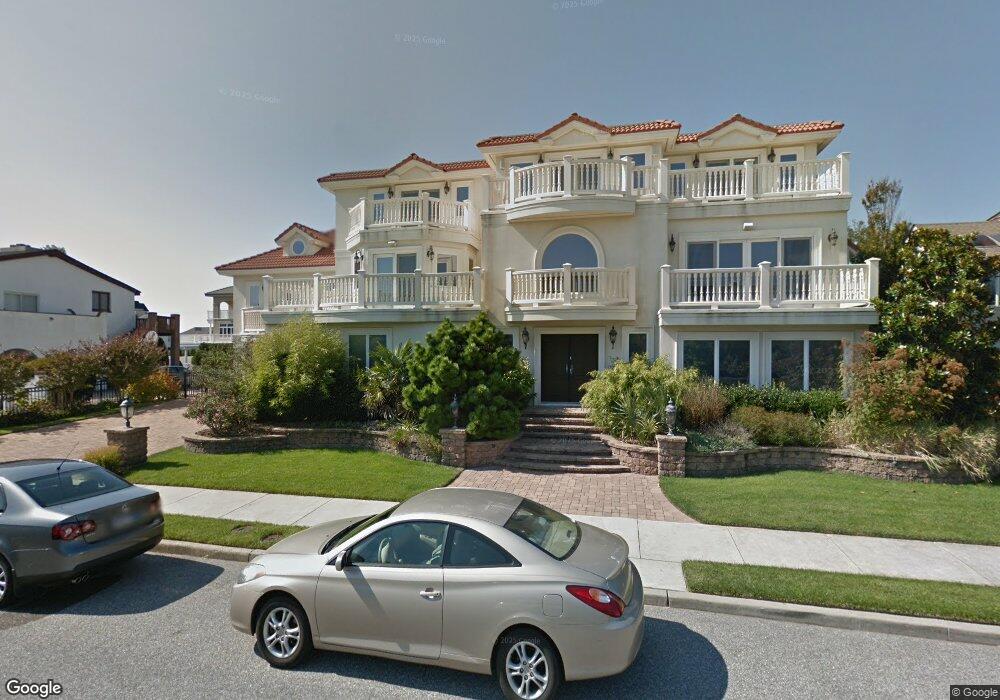
4198 Bayberry Rd Avalon, NJ 08202
Estimated Value: $5,680,000 - $7,056,000
--
Bed
--
Bath
5,715
Sq Ft
$1,143/Sq Ft
Est. Value
About This Home
This home is located at 4198 Bayberry Rd, Avalon, NJ 08202 and is currently estimated at $6,534,862, approximately $1,143 per square foot. 4198 Bayberry Rd is a home located in Cape May County with nearby schools including Avalon Elementary School.
Ownership History
Date
Name
Owned For
Owner Type
Purchase Details
Closed on
Apr 27, 2000
Sold by
Herdelin Robert Nils
Bought by
Quinn Daniel P
Current Estimated Value
Home Financials for this Owner
Home Financials are based on the most recent Mortgage that was taken out on this home.
Original Mortgage
$1,095,000
Outstanding Balance
$380,197
Interest Rate
8.21%
Estimated Equity
$6,154,665
Purchase Details
Closed on
Oct 11, 1996
Sold by
Narrican Stephen R
Bought by
Herdelin Robert N
Home Financials for this Owner
Home Financials are based on the most recent Mortgage that was taken out on this home.
Original Mortgage
$395,000
Interest Rate
8.22%
Purchase Details
Closed on
Jun 19, 1996
Sold by
Hudnaich Jas
Bought by
Herdelin Robt
Home Financials for this Owner
Home Financials are based on the most recent Mortgage that was taken out on this home.
Original Mortgage
$350,000
Interest Rate
8.05%
Create a Home Valuation Report for This Property
The Home Valuation Report is an in-depth analysis detailing your home's value as well as a comparison with similar homes in the area
Home Values in the Area
Average Home Value in this Area
Purchase History
| Date | Buyer | Sale Price | Title Company |
|---|---|---|---|
| Quinn Daniel P | $1,150,000 | -- | |
| Herdelin Robert N | $910,000 | -- | |
| Herdelin Robt | $693,800 | -- |
Source: Public Records
Mortgage History
| Date | Status | Borrower | Loan Amount |
|---|---|---|---|
| Open | Quinn Daniel P | $1,095,000 | |
| Previous Owner | Herdelin Robert N | $395,000 | |
| Previous Owner | Herdelin Robt | $350,000 |
Source: Public Records
Tax History Compared to Growth
Tax History
| Year | Tax Paid | Tax Assessment Tax Assessment Total Assessment is a certain percentage of the fair market value that is determined by local assessors to be the total taxable value of land and additions on the property. | Land | Improvement |
|---|---|---|---|---|
| 2025 | $22,180 | $3,612,400 | $1,750,000 | $1,862,400 |
| 2024 | $22,180 | $3,612,400 | $1,750,000 | $1,862,400 |
| 2023 | $22,000 | $3,612,400 | $1,750,000 | $1,862,400 |
| 2022 | $20,518 | $3,612,400 | $1,750,000 | $1,862,400 |
| 2021 | $19,760 | $3,612,400 | $1,750,000 | $1,862,400 |
| 2020 | $19,001 | $3,612,400 | $1,750,000 | $1,862,400 |
| 2019 | $18,423 | $3,612,400 | $1,750,000 | $1,862,400 |
| 2018 | $17,629 | $3,612,400 | $1,750,000 | $1,862,400 |
| 2017 | $15,944 | $2,867,700 | $1,742,500 | $1,125,200 |
| 2016 | $15,772 | $2,867,700 | $1,742,500 | $1,125,200 |
| 2015 | $15,514 | $2,867,700 | $1,742,500 | $1,125,200 |
| 2014 | $15,342 | $2,867,700 | $1,742,500 | $1,125,200 |
Source: Public Records
Map
Nearby Homes