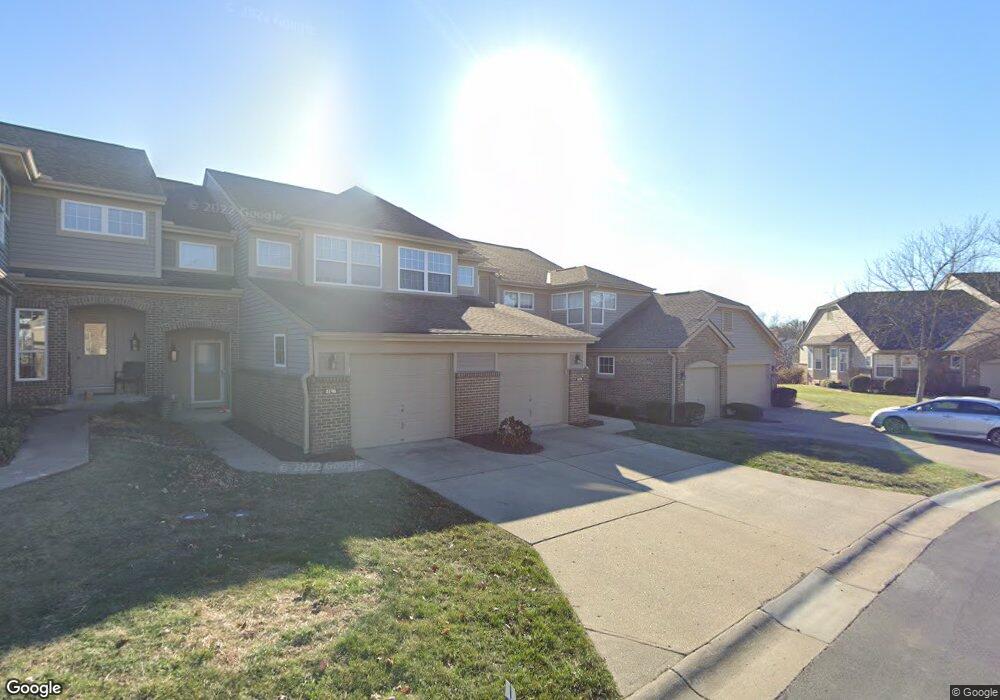
4198 Intrepid Dr Cincinnati, OH 45252
Estimated Value: $265,000 - $302,000
3
Beds
2
Baths
1,817
Sq Ft
$153/Sq Ft
Est. Value
About This Home
This home is located at 4198 Intrepid Dr, Cincinnati, OH 45252 and is currently estimated at $277,803, approximately $152 per square foot. 4198 Intrepid Dr is a home located in Hamilton County with nearby schools including Colerain Elementary School, Colerain Middle School, and Colerain High School.
Ownership History
Date
Name
Owned For
Owner Type
Purchase Details
Closed on
Oct 20, 2022
Sold by
Obrien Kevin R
Bought by
Steinbach Donna J
Current Estimated Value
Purchase Details
Closed on
Dec 4, 2014
Sold by
Davis Daniel M and Davis Gail A
Bought by
Brien Kevin R O
Home Financials for this Owner
Home Financials are based on the most recent Mortgage that was taken out on this home.
Original Mortgage
$110,600
Interest Rate
3.99%
Mortgage Type
Commercial
Purchase Details
Closed on
Feb 2, 1994
Sold by
Henry Fischer Builder Inc
Bought by
Davis Daniel M and Davis Gail A
Home Financials for this Owner
Home Financials are based on the most recent Mortgage that was taken out on this home.
Original Mortgage
$118,500
Interest Rate
7.31%
Create a Home Valuation Report for This Property
The Home Valuation Report is an in-depth analysis detailing your home's value as well as a comparison with similar homes in the area
Home Values in the Area
Average Home Value in this Area
Purchase History
| Date | Buyer | Sale Price | Title Company |
|---|---|---|---|
| Steinbach Donna J | $245,000 | -- | |
| Steinbach Donna J | $245,000 | None Listed On Document | |
| Brien Kevin R O | $147,500 | Attorney | |
| Davis Daniel M | -- | -- |
Source: Public Records
Mortgage History
| Date | Status | Borrower | Loan Amount |
|---|---|---|---|
| Previous Owner | Brien Kevin R O | $110,600 | |
| Previous Owner | Davis Daniel M | $118,500 |
Source: Public Records
Tax History
| Year | Tax Paid | Tax Assessment Tax Assessment Total Assessment is a certain percentage of the fair market value that is determined by local assessors to be the total taxable value of land and additions on the property. | Land | Improvement |
|---|---|---|---|---|
| 2025 | $5,051 | $85,750 | $10,500 | $75,250 |
| 2024 | $4,808 | $85,750 | $10,500 | $75,250 |
| 2023 | $4,753 | $85,750 | $10,500 | $75,250 |
| 2022 | $3,903 | $57,589 | $8,750 | $48,839 |
| 2021 | $3,941 | $57,589 | $8,750 | $48,839 |
| 2020 | $3,894 | $57,589 | $8,750 | $48,839 |
| 2019 | $3,760 | $51,625 | $8,750 | $42,875 |
| 2018 | $3,382 | $51,625 | $8,750 | $42,875 |
| 2017 | $3,249 | $51,625 | $8,750 | $42,875 |
| 2016 | $3,224 | $50,015 | $8,050 | $41,965 |
| 2015 | $3,210 | $50,015 | $8,050 | $41,965 |
| 2014 | $2,525 | $50,015 | $8,050 | $41,965 |
| 2013 | $2,657 | $54,366 | $8,750 | $45,616 |
Source: Public Records
Map
Nearby Homes
- 4086 Resolute Cir Unit 481
- 4187 Intrepid Dr Unit 38
- 3834 Enterprise Cir
- 4230 Endeavor Dr Unit 101
- 4002 Resolute Cir
- 4221 Endeavor Dr
- 3918 Enterprise Cir Unit 532
- 9905 Regatta Dr
- 4220 Endeavor Dr
- 9800 Regatta Dr
- 4771 Dry Ridge Rd
- 3776 Sagebrush Ln
- 10263 Colerain Ave
- 3724 Yellowstone Dr
- 9873 Kittywood Dr
- 9970 Hollis Dr
- 3455 Redskin Dr
- 3484 Niagara St
- 3420 Grovewood Dr
- 3419 Niagara St
- 4194 Intrepid Dr Unit 26
- 4198 Intrepid Dr Unit 24
- 4192 Intrepid Dr
- 4190 Intrepid Dr Unit 28
- 4196 Intrepid Dr
- 4186 Intrepid Dr
- 4184 Intrepid Dr Unit 30
- 4193 Intrepid Dr
- 4193 Intrepid Dr Unit 41
- 4185 Intrepid Dr Unit 37
- 4195 Intrepid Dr
- 4191 Intrepid Dr
- 4189 Intrepid Dr
- 4195 Intrepid Dr Unit 42
- 4180 Intrepid Dr
- 4182 Intrepid Dr
- 4180 Intrepid Dr Unit 32
- 4216 Intrepid Dr
- 4214 Intrepid Dr Unit 22
- 4220 Intrepid Dr
Your Personal Tour Guide
Ask me questions while you tour the home.