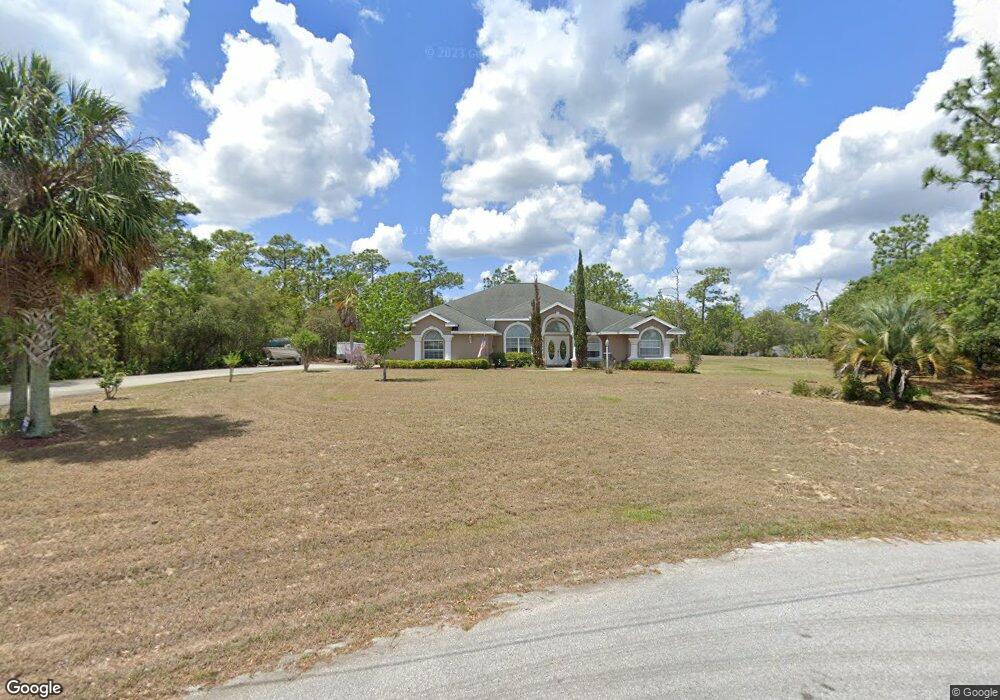
4198 N Millstone Point Beverly Hills, FL 34465
Estimated Value: $573,849 - $704,000
4
Beds
3
Baths
2,901
Sq Ft
$215/Sq Ft
Est. Value
About This Home
This home is located at 4198 N Millstone Point, Beverly Hills, FL 34465 and is currently estimated at $622,462, approximately $214 per square foot. 4198 N Millstone Point is a home located in Citrus County with nearby schools including Crystal River High School, Central Ridge Elementary School, and Crystal River Middle School.
Ownership History
Date
Name
Owned For
Owner Type
Purchase Details
Closed on
Nov 26, 2024
Sold by
Hansbury Edward R and Hansbury Mary S
Bought by
Hansbury Edward R and Hansbury Mary S
Current Estimated Value
Purchase Details
Closed on
Jan 12, 2010
Sold by
Regions Bank
Bought by
Hansbury Edward R and Hansbury Mary S
Home Financials for this Owner
Home Financials are based on the most recent Mortgage that was taken out on this home.
Original Mortgage
$100,000
Interest Rate
4.94%
Mortgage Type
New Conventional
Purchase Details
Closed on
Sep 17, 2009
Sold by
Barber David and Case #09 2009 Ca 000897
Bought by
Regions Bank
Purchase Details
Closed on
Sep 1, 2009
Bought by
Hansbury Edward R and Hansbury Mary S
Purchase Details
Closed on
Jun 20, 2002
Sold by
Loveless David F
Bought by
Barber David
Purchase Details
Closed on
Feb 1, 1996
Bought by
Hansbury Edward R and Hansbury Mary S
Create a Home Valuation Report for This Property
The Home Valuation Report is an in-depth analysis detailing your home's value as well as a comparison with similar homes in the area
Home Values in the Area
Average Home Value in this Area
Purchase History
| Date | Buyer | Sale Price | Title Company |
|---|---|---|---|
| Hansbury Edward R | -- | None Listed On Document | |
| Hansbury Edward R | -- | None Listed On Document | |
| Hansbury Edward R | $258,000 | Southern Security Title Serv | |
| Regions Bank | -- | None Available | |
| Regions Bank | -- | None Available | |
| Hansbury Edward R | $100 | -- | |
| Barber David | $18,000 | Manatee Title Co Inc | |
| Hansbury Edward R | $23,800 | -- |
Source: Public Records
Mortgage History
| Date | Status | Borrower | Loan Amount |
|---|---|---|---|
| Previous Owner | Hansbury Edward R | $100,000 |
Source: Public Records
Tax History Compared to Growth
Tax History
| Year | Tax Paid | Tax Assessment Tax Assessment Total Assessment is a certain percentage of the fair market value that is determined by local assessors to be the total taxable value of land and additions on the property. | Land | Improvement |
|---|---|---|---|---|
| 2024 | $2,120 | $173,788 | -- | -- |
| 2023 | $2,120 | $168,726 | $0 | $0 |
| 2022 | $1,986 | $163,812 | $0 | $0 |
| 2021 | $1,907 | $159,041 | $0 | $0 |
| 2020 | $1,805 | $297,970 | $15,160 | $282,810 |
| 2019 | $1,780 | $274,591 | $14,950 | $259,641 |
| 2018 | $1,526 | $263,946 | $13,640 | $250,306 |
| 2017 | $1,518 | $132,631 | $14,050 | $118,581 |
| 2016 | $1,533 | $129,903 | $14,170 | $115,733 |
| 2015 | $1,553 | $129,000 | $14,470 | $114,530 |
| 2014 | $1,584 | $127,976 | $16,440 | $111,536 |
Source: Public Records
Map
Nearby Homes
- 4400 N Deckwood Dr
- 4373 N Saddletree Dr
- 4622 N Pink Poppy Dr
- 4690 W Tomahawk Dr
- 4577 W Tomahawk Dr
- 5332 W Comstock Place
- 5396 W Pine Ridge Blvd
- 5685 W Pine Ridge Blvd
- 4923 W Phoenix Dr
- 3598 N Yacht Terrace
- 4881 W Phoenix Dr
- 5408 W Corral Place
- 5338 W Corral Place
- 3428 N Bravo Dr
- 4491 W Stable Ct
- 5235 N Sonora Terrace
- 5219 N El Paso Terrace
- 6133 W Ponderosa Place
- 4347 W Pansy Dr
- 4226 W Pansy Dr
- 4222 N Millstone Point
- 4167 N Deckwood Dr
- 4185 N Millstone Point
- 4134 N Millstone Point
- 4149 N Millstone Point
- 4135 N Deckwood Dr
- 4312 N Deckwood Dr
- 4084 N Deckwood Dr
- 4393 N Saddle Dr
- 4403 N Saddle Dr Unit 6
- 4403 N Saddle Dr
- 4232 N Deckwood Dr
- 4415 N Saddle Dr
- 5175 W Piute Dr
- 4188 N Chisholm Point
- 4427 N Saddle
- 5231 W Piute Dr
- 4371 N Saddle Dr
- 4083 N Millstone Point
- 4124 N Chisholm Point