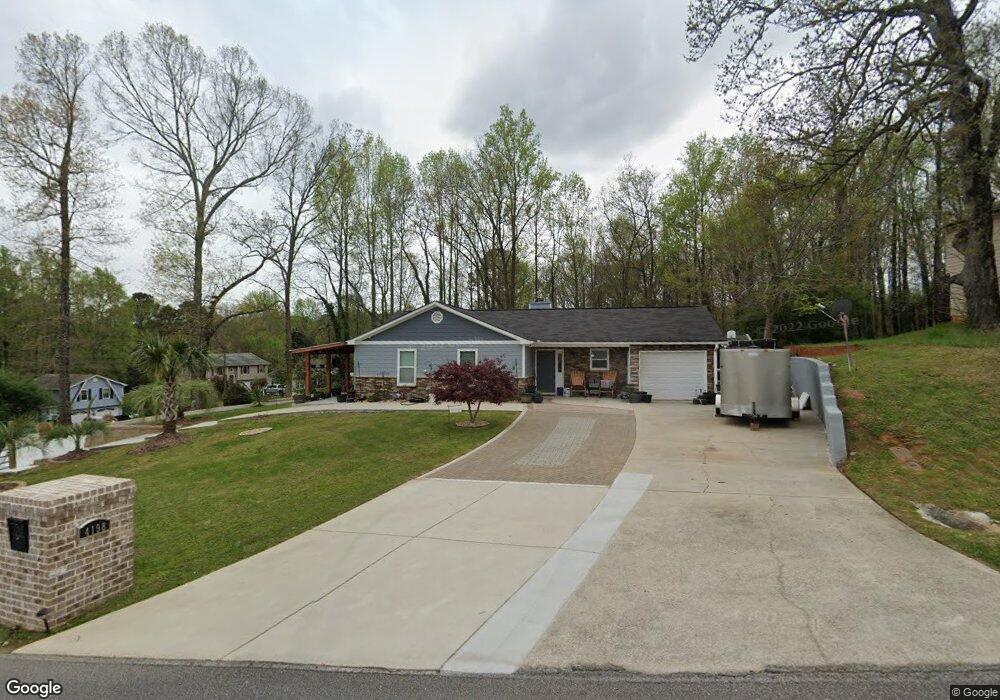
4198 Warren Rd Flowery Branch, GA 30542
Estimated Value: $307,981 - $335,000
3
Beds
2
Baths
1,172
Sq Ft
$276/Sq Ft
Est. Value
About This Home
This home is located at 4198 Warren Rd, Flowery Branch, GA 30542 and is currently estimated at $323,745, approximately $276 per square foot. 4198 Warren Rd is a home located in Hall County with nearby schools including Martin Elementary School, Southwest Middle School, and C.W. Davis Middle School.
Ownership History
Date
Name
Owned For
Owner Type
Purchase Details
Closed on
May 30, 2022
Sold by
Mata Israel
Bought by
Mata Maria Guadalupe and Munoz Jennifer
Current Estimated Value
Purchase Details
Closed on
Mar 24, 2004
Sold by
Carlson Richard and Carlson Janice
Bought by
Mata Israel and Mata Petra
Home Financials for this Owner
Home Financials are based on the most recent Mortgage that was taken out on this home.
Original Mortgage
$116,471
Interest Rate
5.62%
Mortgage Type
VA
Purchase Details
Closed on
Jan 7, 2003
Sold by
Chase Mtg Company-West
Bought by
Sec Of Hud
Purchase Details
Closed on
Jan 20, 1998
Sold by
Nix Randall J and Nix Claudia U
Bought by
Harmon Alicen L
Home Financials for this Owner
Home Financials are based on the most recent Mortgage that was taken out on this home.
Original Mortgage
$78,100
Interest Rate
7.07%
Mortgage Type
New Conventional
Create a Home Valuation Report for This Property
The Home Valuation Report is an in-depth analysis detailing your home's value as well as a comparison with similar homes in the area
Home Values in the Area
Average Home Value in this Area
Purchase History
| Date | Buyer | Sale Price | Title Company |
|---|---|---|---|
| Mata Maria Guadalupe | -- | -- | |
| Mata Israel | $118,400 | -- | |
| Sec Of Hud | -- | -- | |
| Chase Mtg Company-West | $93,158 | -- | |
| Harmon Alicen L | $79,900 | -- |
Source: Public Records
Mortgage History
| Date | Status | Borrower | Loan Amount |
|---|---|---|---|
| Previous Owner | Mata Israel | $116,471 | |
| Previous Owner | Harmon Alicen L | $78,100 |
Source: Public Records
Tax History Compared to Growth
Tax History
| Year | Tax Paid | Tax Assessment Tax Assessment Total Assessment is a certain percentage of the fair market value that is determined by local assessors to be the total taxable value of land and additions on the property. | Land | Improvement |
|---|---|---|---|---|
| 2024 | $3,026 | $119,600 | $19,080 | $100,520 |
| 2023 | $2,924 | $115,480 | $17,360 | $98,120 |
| 2022 | $2,481 | $93,560 | $16,720 | $76,840 |
| 2021 | $1,749 | $63,880 | $8,840 | $55,040 |
| 2020 | $1,634 | $57,760 | $8,040 | $49,720 |
| 2019 | $1,589 | $55,600 | $8,480 | $47,120 |
| 2018 | $1,432 | $48,200 | $8,480 | $39,720 |
| 2017 | $1,119 | $37,480 | $8,480 | $29,000 |
| 2016 | $1,035 | $35,320 | $8,480 | $26,840 |
| 2015 | $939 | $31,560 | $8,480 | $23,080 |
| 2014 | $939 | $31,560 | $8,480 | $23,080 |
Source: Public Records
Map
Nearby Homes
- 4086 Parks Rd
- 4684 Martins Crossing Dr W
- 4020 Parks Rd
- 4838 Netherlands Place
- 4003 Warren Rd
- 4021 Laurant Path
- 4042 Alderstone Dr
- 4013 Laurant Path
- 4054 Alderstone Dr
- 4050 Alderstone Dr
- 4743 Amsterdam Ln
- 3929 Perry Ln
- 3979 Alderstone Dr
- 3987 Alderstone Dr
- 3983 Alderstone Dr
- Wakehurst Plan at Falls Creek
- 3935 Alderstone Dr
- Sheridan Plan at Falls Creek
- 4192 Warren Rd
- 4210 Burgundy Way
- 4205 Burgundy Way
- 4199 Warren Rd
- 4203 Warren Rd
- 4197 Warren Rd
- 4186 Warren Rd
- 4193 Warren Rd
- 4216 Burgundy Way
- 4209 Burgundy Way
- 4157 Burgundy Way
- 4189 Warren Rd
- 4213 Burgundy Way
- 4180 Warren Rd
- 4217 Burgundy Way
- 4185 Warren Rd
- 0 Burgundy Way
- 4153 Burgundy Way
- 4181 Warren Rd