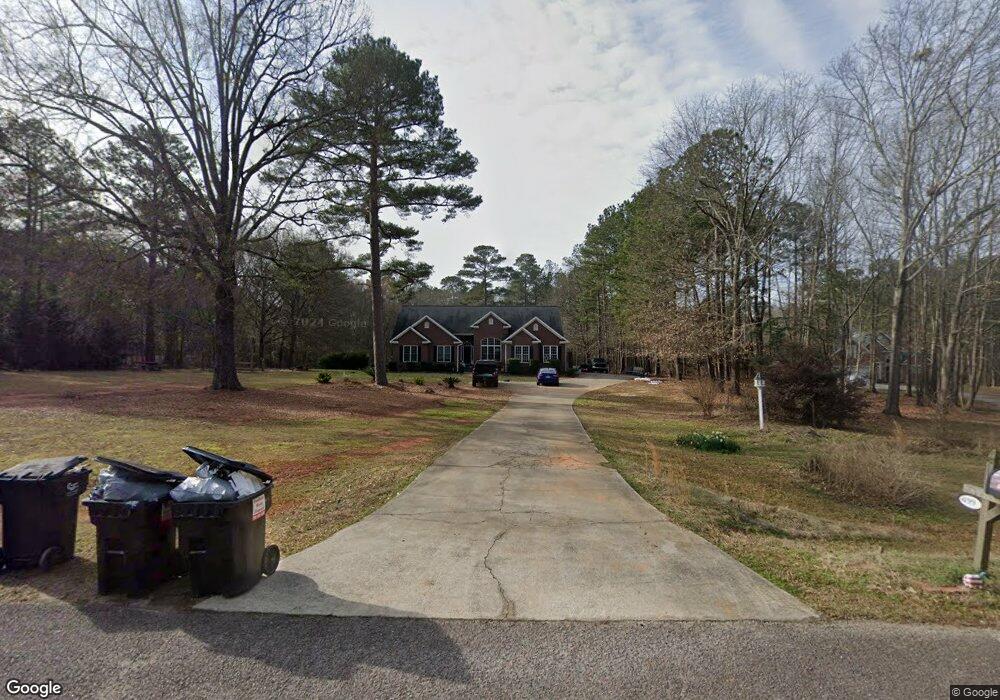
4199 Waters Edge Ln Appling, GA 30802
Estimated Value: $500,000 - $583,000
4
Beds
3
Baths
2,779
Sq Ft
$192/Sq Ft
Est. Value
About This Home
This home is located at 4199 Waters Edge Ln, Appling, GA 30802 and is currently estimated at $533,301, approximately $191 per square foot. 4199 Waters Edge Ln is a home located in Columbia County with nearby schools including North Columbia Elementary School, Harlem Middle School, and Suncoast Community High School.
Ownership History
Date
Name
Owned For
Owner Type
Purchase Details
Closed on
Nov 22, 2024
Sold by
Mason Christian J
Bought by
Mason Grant Ellsworth and Mason Jarrett A
Current Estimated Value
Purchase Details
Closed on
Jun 4, 2007
Sold by
Denton Ray C
Bought by
Mason Julie A
Home Financials for this Owner
Home Financials are based on the most recent Mortgage that was taken out on this home.
Original Mortgage
$205,000
Interest Rate
6.12%
Mortgage Type
New Conventional
Purchase Details
Closed on
Jan 29, 2004
Sold by
Edwards Andrew E
Bought by
Denton Ray C
Home Financials for this Owner
Home Financials are based on the most recent Mortgage that was taken out on this home.
Original Mortgage
$23,432
Interest Rate
5.85%
Mortgage Type
Purchase Money Mortgage
Create a Home Valuation Report for This Property
The Home Valuation Report is an in-depth analysis detailing your home's value as well as a comparison with similar homes in the area
Home Values in the Area
Average Home Value in this Area
Purchase History
| Date | Buyer | Sale Price | Title Company |
|---|---|---|---|
| Mason Grant Ellsworth | -- | -- | |
| Mason Christian J | -- | -- | |
| Mason Julie A | $305,000 | -- | |
| Denton Ray C | $29,000 | -- |
Source: Public Records
Mortgage History
| Date | Status | Borrower | Loan Amount |
|---|---|---|---|
| Previous Owner | Mason Julie A | $205,000 | |
| Previous Owner | Denton Ray C | $23,432 |
Source: Public Records
Tax History Compared to Growth
Tax History
| Year | Tax Paid | Tax Assessment Tax Assessment Total Assessment is a certain percentage of the fair market value that is determined by local assessors to be the total taxable value of land and additions on the property. | Land | Improvement |
|---|---|---|---|---|
| 2025 | $4,003 | $167,364 | $29,237 | $138,127 |
| 2024 | $3,653 | $145,839 | $29,237 | $116,602 |
| 2023 | $3,653 | $135,102 | $24,197 | $110,905 |
| 2022 | $3,422 | $131,429 | $24,197 | $107,232 |
| 2021 | $3,343 | $122,761 | $23,882 | $98,879 |
| 2020 | $3,450 | $124,122 | $23,567 | $100,555 |
| 2019 | $3,579 | $128,745 | $21,047 | $107,698 |
| 2018 | $3,474 | $124,564 | $21,047 | $103,517 |
| 2017 | $3,370 | $120,401 | $17,267 | $103,134 |
| 2016 | $2,949 | $109,230 | $14,338 | $94,892 |
| 2015 | $2,862 | $105,804 | $14,338 | $91,466 |
| 2014 | $2,819 | $102,955 | $14,338 | $88,617 |
Source: Public Records
Map
Nearby Homes
- 6710 Washington Rd
- 0 Ridge Rd
- 6452 Washington Rd
- 6275 Ridge Rd
- Lot 1-E Ridge Rd
- LOT B Ridge Rd
- LOT C Ridge Rd
- 6312 Keg Creek Dr
- 6205 Keg Creek Dr
- 4121 Pine Ridge Rd
- 1102 Dogwood Dr
- 520 Abundance Way
- 6075 Stb3 Ridge Rd
- 6.55 ACRES S Lakeshore Dr
- 00 Bonner Rd
- 3320 Ray Owens Rd
- 3316 Ray Owens Rd
- LOT 22 Plantation Point Rd
- 0 Dove Ct Unit 545783
- 6982 Moontown Dr E
- 4193 Waters Edge Ln
- 4194 Waters Edge Ln
- 4187 Waters Edge Ln
- Lot C Washington Rd
- 4188 Waters Edge Ln
- 4179 Waters Edge Ln
- 6703 Washington Rd
- Lot A Washington Rd
- 6748 Washington Rd
- 4169 Waters Edge Ln
- 6698 Washington Rd
- 6754 Washington Rd
- 4174 Waters Edge Ln
- 4178 Waters Edge Ln
- Lot B Washington Rd
- 6762 Washington Rd
- 6697 Washington Rd
- 4170 Waters Edge Ln
- 6690 Washington Rd
- 4168 Waters Edge Ln