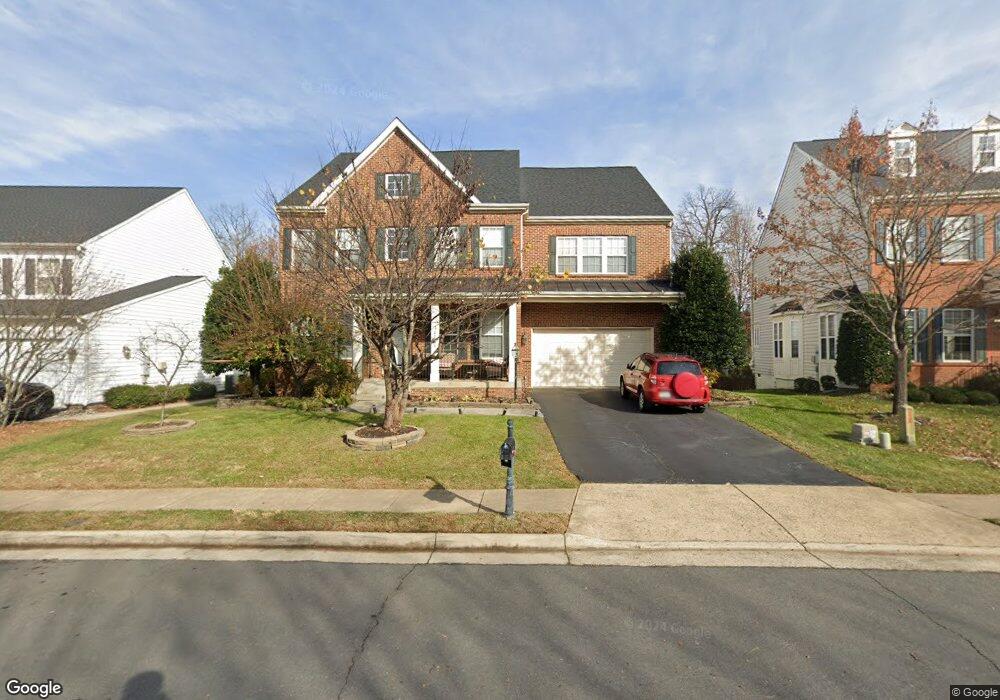
41994 Pepperbush Place Stone Ridge, VA 20105
Estimated Value: $998,337 - $1,076,000
4
Beds
4
Baths
3,362
Sq Ft
$308/Sq Ft
Est. Value
About This Home
This home is located at 41994 Pepperbush Place, Stone Ridge, VA 20105 and is currently estimated at $1,037,084, approximately $308 per square foot. 41994 Pepperbush Place is a home located in Loudoun County with nearby schools including Arcola Elementary School, Mercer Middle School, and John Champe High School.
Ownership History
Date
Name
Owned For
Owner Type
Purchase Details
Closed on
Jul 30, 2021
Sold by
Rangbar Sonita and Ozdincer Recep E
Bought by
Reangbar Sina
Current Estimated Value
Home Financials for this Owner
Home Financials are based on the most recent Mortgage that was taken out on this home.
Original Mortgage
$289,000
Outstanding Balance
$178,777
Interest Rate
2.25%
Mortgage Type
Stand Alone Refi Refinance Of Original Loan
Estimated Equity
$858,307
Purchase Details
Closed on
Jun 23, 2017
Sold by
Rangbar Ajmal and Rangbar Ahmad K
Bought by
Rangbar Ahmad K and Rangbar Sonita
Purchase Details
Closed on
Mar 18, 2005
Sold by
Centex Homes
Bought by
Rahim Mansur and Reangber,Sina
Home Financials for this Owner
Home Financials are based on the most recent Mortgage that was taken out on this home.
Original Mortgage
$390,150
Interest Rate
5.64%
Mortgage Type
New Conventional
Create a Home Valuation Report for This Property
The Home Valuation Report is an in-depth analysis detailing your home's value as well as a comparison with similar homes in the area
Home Values in the Area
Average Home Value in this Area
Purchase History
| Date | Buyer | Sale Price | Title Company |
|---|---|---|---|
| Reangbar Sina | -- | None Available | |
| Rangbar Ahmad K | -- | None Available | |
| Rahim Mansur | $557,405 | -- |
Source: Public Records
Mortgage History
| Date | Status | Borrower | Loan Amount |
|---|---|---|---|
| Open | Reangbar Sina | $289,000 | |
| Previous Owner | Rahim Mansur | $390,150 |
Source: Public Records
Tax History Compared to Growth
Tax History
| Year | Tax Paid | Tax Assessment Tax Assessment Total Assessment is a certain percentage of the fair market value that is determined by local assessors to be the total taxable value of land and additions on the property. | Land | Improvement |
|---|---|---|---|---|
| 2025 | $8,084 | $1,004,210 | $298,500 | $705,710 |
| 2024 | $7,952 | $919,290 | $273,500 | $645,790 |
| 2023 | $7,473 | $854,050 | $273,500 | $580,550 |
| 2022 | $7,027 | $789,600 | $243,500 | $546,100 |
| 2021 | $6,544 | $667,750 | $208,500 | $459,250 |
| 2020 | $6,398 | $618,160 | $198,500 | $419,660 |
| 2019 | $6,179 | $591,250 | $198,500 | $392,750 |
| 2018 | $6,224 | $573,620 | $178,500 | $395,120 |
| 2017 | $6,127 | $544,620 | $178,500 | $366,120 |
| 2016 | $6,340 | $553,720 | $0 | $0 |
| 2015 | $6,573 | $400,620 | $0 | $400,620 |
| 2014 | $6,333 | $369,800 | $0 | $369,800 |
Source: Public Records
Map
Nearby Homes
- 24787 Wind River Dr
- 24769 Stone Pillar Dr
- 41904 Beryl Terrace
- 24687 Kings Canyon Square
- 42104 Fremont Preserve Square
- 24634 Rosebay Terrace
- 24641 Greysteel Square
- 24847 Mason Dale Terrace
- 24660 Woolly Mammoth Terrace Unit 404
- 24821 Beardgrass Place
- 24876 Helms Terrace
- 24661 Clock Tower Square
- 24636 Woolly Mammoth Terrace Unit 401
- 42210 Terrazzo Terrace
- 24701 Byrne Meadow Square Unit 100
- 41900 Metamorphic Square Unit 405
- 41956 Pickwick Mill Terrace
- 24558 Rosebay Terrace
- 42063 Berkley Hill Terrace
- 42291 Onyx Terrace
- 41990 Pepperbush Place
- 41998 Pepperbush Place
- 41995 Pepperbush Place
- 41999 Pepperbush Place
- 24805 High Plateau Ct
- 24801 High Plateau Ct
- 42003 Pepperbush Place
- 24809 High Plateau Ct
- 24797 High Plateau Ct
- 24820 Hornfels Ct
- 24816 Hornfels Ct
- 42006 Pepperbush Place
- 41921 Feldspar Place
- 24812 Hornfels Ct
- 24813 High Plateau Ct
- 42007 Pepperbush Place
- 24793 High Plateau Ct
- 24808 Hornfels Ct
- 41917 Feldspar Place
- 24804 High Plateau Ct