Estimated Value: $1,121,000 - $1,532,983
3
Beds
5
Baths
5,785
Sq Ft
$229/Sq Ft
Est. Value
About This Home
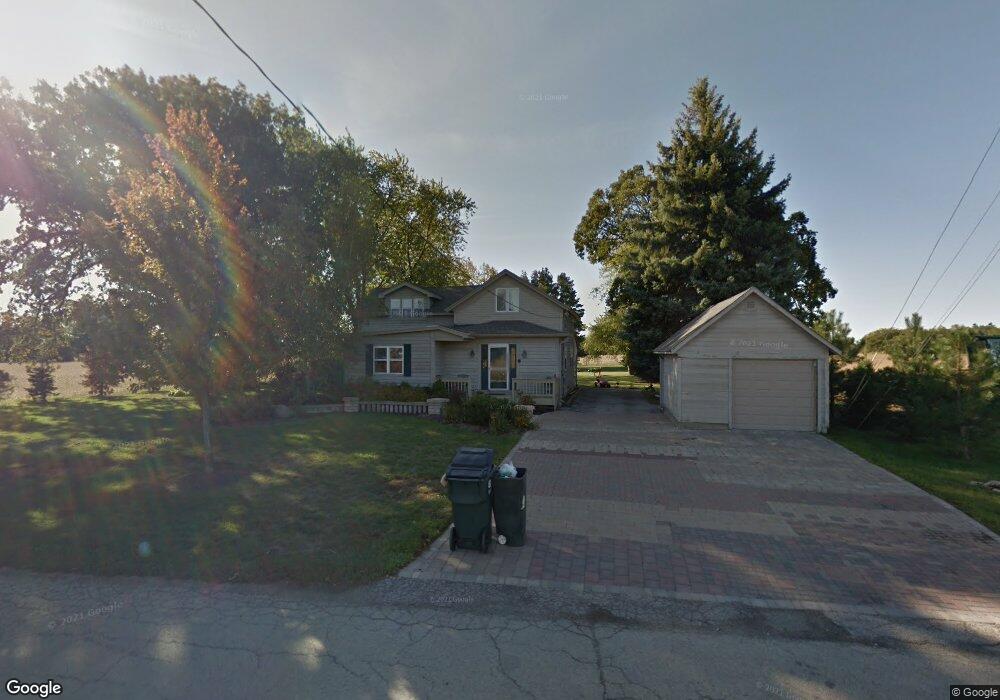
This home is located at 41W207 Lenz Rd, Elgin, IL 60124 and is currently estimated at $1,326,992, approximately $229 per square foot. 41W207 Lenz Rd is a home with nearby schools including Lily Lake Grade School, Prairie Knolls Middle School, and Central Middle School.
Ownership History
Date
Name
Owned For
Owner Type
Purchase Details
Closed on
May 23, 2024
Sold by
Petsche Timothy S and Petsche Vicki M
Bought by
Timothy Petsche Revocable Trust and Vicki Petsche Revocable Trust
Current Estimated Value
Purchase Details
Closed on
Jun 17, 2004
Sold by
Chicago Title Land Trust Co
Bought by
Petsche Timothy S and Petsche Vicki M
Home Financials for this Owner
Home Financials are based on the most recent Mortgage that was taken out on this home.
Original Mortgage
$548,000
Interest Rate
5.62%
Mortgage Type
Purchase Money Mortgage
Purchase Details
Closed on
Aug 27, 2003
Sold by
Koper Z John and Koper Pamela M
Bought by
Chicago Title Land Trust Co
Home Financials for this Owner
Home Financials are based on the most recent Mortgage that was taken out on this home.
Original Mortgage
$490,000
Interest Rate
6.18%
Mortgage Type
Purchase Money Mortgage
Create a Home Valuation Report for This Property
The Home Valuation Report is an in-depth analysis detailing your home's value as well as a comparison with similar homes in the area
Home Values in the Area
Average Home Value in this Area
Purchase History
| Date | Buyer | Sale Price | Title Company |
|---|---|---|---|
| Timothy Petsche Revocable Trust | -- | None Listed On Document | |
| Petsche Timothy S | $685,000 | Ticor Title Insurance Co | |
| Chicago Title Land Trust Co | $490,000 | Fox Title Company |
Source: Public Records
Mortgage History
| Date | Status | Borrower | Loan Amount |
|---|---|---|---|
| Previous Owner | Petsche Timothy S | $548,000 | |
| Previous Owner | Chicago Title Land Trust Co | $490,000 | |
| Closed | Petsche Timothy S | $137,000 |
Source: Public Records
Tax History Compared to Growth
Tax History
| Year | Tax Paid | Tax Assessment Tax Assessment Total Assessment is a certain percentage of the fair market value that is determined by local assessors to be the total taxable value of land and additions on the property. | Land | Improvement |
|---|---|---|---|---|
| 2024 | $28,980 | $385,136 | $54,505 | $330,631 |
| 2023 | $28,146 | $350,529 | $49,462 | $301,067 |
| 2022 | $27,326 | $328,229 | $48,418 | $279,811 |
| 2021 | $27,156 | $317,422 | $46,583 | $270,839 |
| 2020 | $27,073 | $311,732 | $45,487 | $266,245 |
| 2019 | $27,066 | $307,641 | $44,642 | $262,999 |
| 2018 | $25,396 | $290,581 | $39,381 | $251,200 |
| 2017 | $23,076 | $283,675 | $38,231 | $245,444 |
| 2016 | $24,510 | $277,155 | $37,178 | $239,977 |
| 2015 | -- | $266,822 | $36,396 | $230,426 |
| 2014 | -- | $266,668 | $36,242 | $230,426 |
| 2013 | -- | $248,704 | $36,487 | $212,217 |
Source: Public Records
Map
Nearby Homes
- 41W591 Lenz Rd
- 3689 Thornhill Dr
- 40W156 Sturbridge Way
- 3660 Thornhill Dr
- 4378 John Milton Rd
- 3646 Thornhill Dr
- 1853 Chandolin Ln
- 1831 Chandolin Ln
- 1855 Chandolin Ln
- 40W513 Old Mill Ct
- 41W072 Bowes Rd
- Newcastle Plan at Ponds of Stony Creek - Phase II
- at Ponds of Stony Creek - Phase II
- Windsor Plan at Ponds of Stony Creek - Phase II
- Bluestone Plan at Ponds of Stony Creek - Phase II
- 3616 Sahara Rd
- 3587 Sandstone Cir
- 3608 Sandstone Cir
- 3612 Sandstone Cir
- Auburn Plan at Ponds of Stony Creek - Phase II
- 41W325 Lenz Rd
- 41W381 Lenz Rd
- 41W201 Lenz Rd
- 8N466 Crawford Rd
- 8N466 Crawford Rd
- 41W081 Lenz Rd
- 9N022 Oak Bluff Dr
- 41W415 Lenz Rd
- 9N025 Oak Bluff Dr
- 41W384 Lenz Rd
- 41W300 Lenz Rd
- 8N660 Crawford Rd
- 9N044 Oak Bluff Dr
- 8N474 Crawford Rd
- 41W348 McDonald Rd
- 9N051 Oak Bluff Dr
- 41W501 Lenz Rd
- 41W460 Lenz Rd
- 41W320 McDonald Rd
- 8N720 Crawford Rd