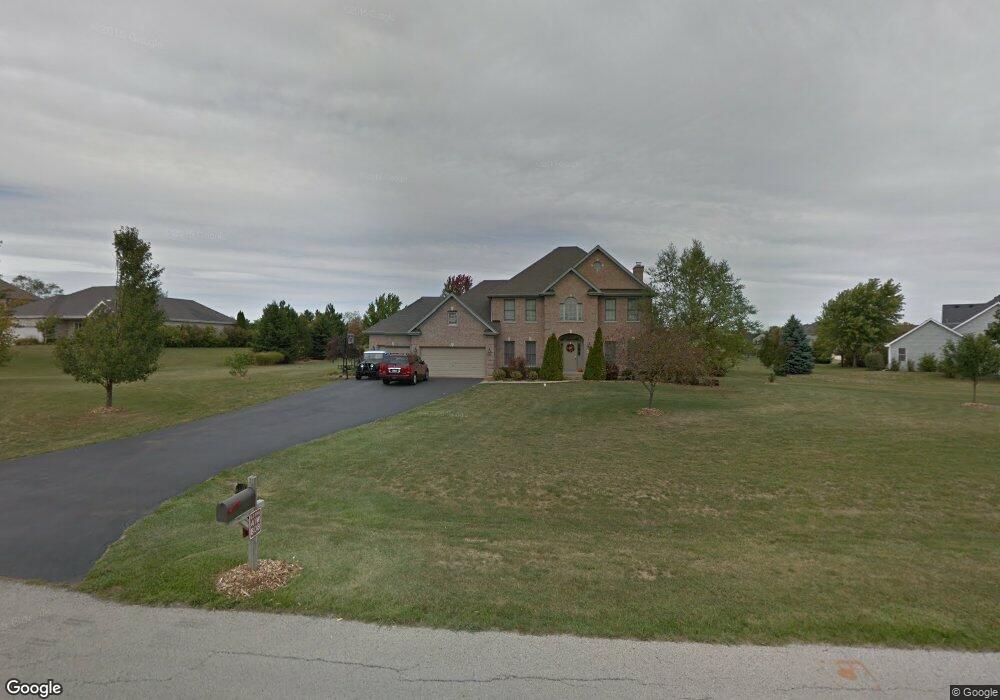
41W808 Hunters Hill Dr Unit 4 Saint Charles, IL 60175
Estimated Value: $631,090 - $724,000
--
Bed
--
Bath
2,957
Sq Ft
$230/Sq Ft
Est. Value
About This Home
This home is located at 41W808 Hunters Hill Dr Unit 4, Saint Charles, IL 60175 and is currently estimated at $679,273, approximately $229 per square foot. 41W808 Hunters Hill Dr Unit 4 is a home located in Kane County with nearby schools including Wasco Elementary School, Thompson Middle School, and St Charles North High School.
Ownership History
Date
Name
Owned For
Owner Type
Purchase Details
Closed on
Apr 5, 1999
Sold by
Tim Kobler Custom Homes Inc
Bought by
Kleefisch Gregory L and Fox Patricia A
Current Estimated Value
Home Financials for this Owner
Home Financials are based on the most recent Mortgage that was taken out on this home.
Original Mortgage
$220,000
Outstanding Balance
$55,244
Interest Rate
6.94%
Estimated Equity
$624,029
Purchase Details
Closed on
Jul 16, 1998
Sold by
Kleefisch Gregory L and Fox Patricia A
Bought by
Tim Kobler Custom Homes Inc
Home Financials for this Owner
Home Financials are based on the most recent Mortgage that was taken out on this home.
Original Mortgage
$34,500
Interest Rate
8.5%
Create a Home Valuation Report for This Property
The Home Valuation Report is an in-depth analysis detailing your home's value as well as a comparison with similar homes in the area
Home Values in the Area
Average Home Value in this Area
Purchase History
| Date | Buyer | Sale Price | Title Company |
|---|---|---|---|
| Kleefisch Gregory L | $331,000 | Chicago Title | |
| Tim Kobler Custom Homes Inc | -- | Advanced Title Services Inc | |
| Kleefisch Gregory L | $69,000 | Advanced Title Services Inc |
Source: Public Records
Mortgage History
| Date | Status | Borrower | Loan Amount |
|---|---|---|---|
| Open | Kleefisch Gregory L | $220,000 | |
| Previous Owner | Tim Kobler Custom Homes Inc | $34,500 |
Source: Public Records
Tax History Compared to Growth
Tax History
| Year | Tax Paid | Tax Assessment Tax Assessment Total Assessment is a certain percentage of the fair market value that is determined by local assessors to be the total taxable value of land and additions on the property. | Land | Improvement |
|---|---|---|---|---|
| 2024 | $11,451 | $181,913 | $26,845 | $155,068 |
| 2023 | $11,141 | $162,640 | $24,001 | $138,639 |
| 2022 | $11,154 | $148,192 | $21,869 | $126,323 |
| 2021 | $10,659 | $139,923 | $20,649 | $119,274 |
| 2020 | $10,636 | $137,910 | $20,352 | $117,558 |
| 2019 | $10,497 | $135,885 | $20,053 | $115,832 |
| 2018 | $10,479 | $135,885 | $20,053 | $115,832 |
| 2017 | $10,378 | $133,890 | $19,759 | $114,131 |
| 2016 | $10,979 | $130,510 | $19,260 | $111,250 |
| 2015 | -- | $126,906 | $18,728 | $108,178 |
| 2014 | -- | $128,852 | $19,015 | $109,837 |
| 2013 | -- | $131,014 | $19,334 | $111,680 |
Source: Public Records
Map
Nearby Homes
- 42W474 Red Bud Ct Unit 2
- 5N683 Ravine Dr
- 42W697 Bridle Ct
- 5N634 Lostview Ln
- 42W641 Jens Jensen Ln Unit 2
- 42W534 Empire Rd
- 40W897 Brown Rd
- 40W778 Ellis Johnson Ln
- 40W758 Ellis Johnson Ln
- 4N884 Old Lafox Rd
- 4N466 Mark Twain St
- 40W630 Winchester Way
- 40W930 Trotter Ln
- 41W540 Burlington Rd
- 24 Autumn Ct
- 40W139 Jack London St
- 40W035 Deer Run Dr
- 40W665 Carriage Ct
- 42W690 Illinois 64
- 6N679 Colonel Bennett Ln
- 41W814 Hunters Hill Dr Unit 4
- 5N094 Hunters Hill Dr Unit 4
- 5N022 Hunters Hill Dr
- 41W818 Hunters Hill Dr Unit 4
- 5N071 Hunters Hill Dr
- 5N132 Hunters Hill Dr Unit 4
- 41W881 Oak Hill Dr Unit 4
- 5N035 Hunters Ln Unit 4
- 5N101 Hunters Hill Dr Unit 4
- 41W950 Hunters Hill Dr
- 41W847 Oak Hill Dr
- 41W913 Oak Hill Dr Unit 4
- 5N007 Hunters Ln
- 41W947 Oak Hill Dr
- 5N155 Hunters Hill Dr
- 4N976 Hunters Ln Unit 4
- 41W988 Hunters Hill Dr
- 41W981 Oak Hill Dr Unit 4
- 4N979 Hunters Ln Unit 4