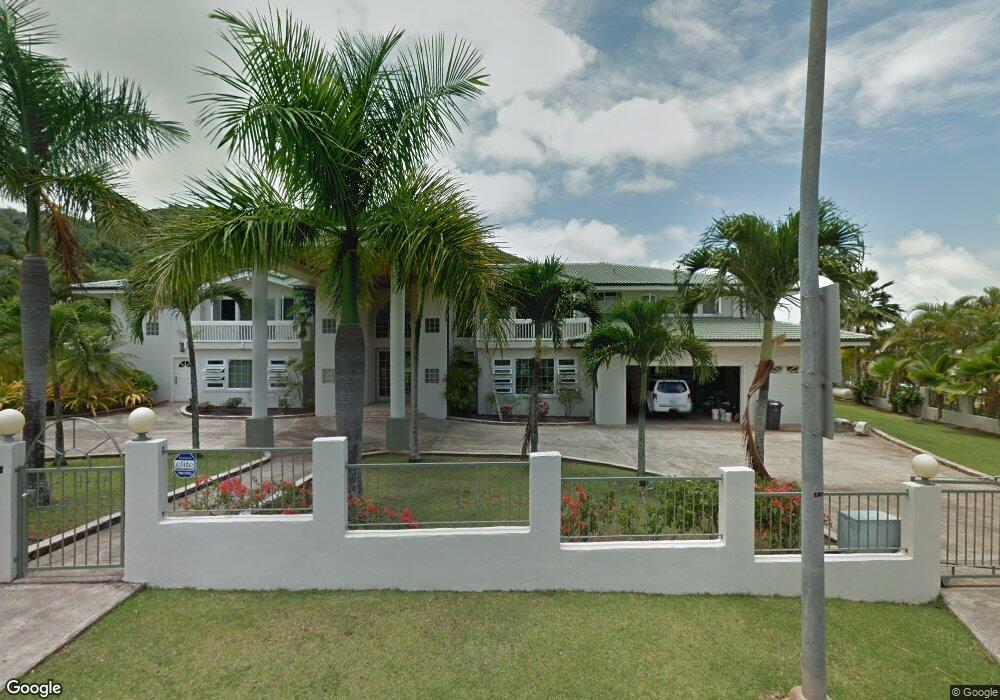
42-107 Aleka Place Kailua, HI 96734
Estimated Value: $2,755,634 - $5,072,000
6
Beds
6
Baths
5,740
Sq Ft
$680/Sq Ft
Est. Value
About This Home
This home is located at 42-107 Aleka Place, Kailua, HI 96734 and is currently estimated at $3,902,211, approximately $679 per square foot. 42-107 Aleka Place is a home located in Honolulu County with nearby schools including Keolu Elementary School, Kailua Intermediate School, and Kailua High School.
Ownership History
Date
Name
Owned For
Owner Type
Purchase Details
Closed on
Jun 28, 2019
Sold by
Uekawa John Kalani and Uekawa Celia Perez
Bought by
Uekawa John K and Uekawa Celia P
Current Estimated Value
Purchase Details
Closed on
Nov 14, 2002
Sold by
Ancheta Orlino Padre and Ancheta Perlita Maderazo
Bought by
Uekawa John Kalani and Uekawa Celia Perez
Home Financials for this Owner
Home Financials are based on the most recent Mortgage that was taken out on this home.
Original Mortgage
$956,000
Outstanding Balance
$396,593
Interest Rate
5.89%
Estimated Equity
$3,505,618
Purchase Details
Closed on
Jun 23, 1997
Sold by
Lee James Alfred
Bought by
Ancheta Orlino P and Ancheta Perlita M
Purchase Details
Closed on
Sep 11, 1995
Sold by
Keolu Lakefront Estates Inc
Bought by
Ancheta Celestino Padre and Ancheta Orlino Padre
Create a Home Valuation Report for This Property
The Home Valuation Report is an in-depth analysis detailing your home's value as well as a comparison with similar homes in the area
Home Values in the Area
Average Home Value in this Area
Purchase History
| Date | Buyer | Sale Price | Title Company |
|---|---|---|---|
| Uekawa John K | -- | None Available | |
| Uekawa John K | -- | None Available | |
| Uekawa John K | -- | None Available | |
| Uekawa John Kalani | $1,250,000 | -- | |
| Ancheta Orlino P | $173,000 | -- | |
| Ancheta Celestino Padre | $200,000 | Old Republic Title & Escrow |
Source: Public Records
Mortgage History
| Date | Status | Borrower | Loan Amount |
|---|---|---|---|
| Open | Uekawa John Kalani | $956,000 | |
| Closed | Uekawa John Kalani | $150,000 |
Source: Public Records
Tax History Compared to Growth
Tax History
| Year | Tax Paid | Tax Assessment Tax Assessment Total Assessment is a certain percentage of the fair market value that is determined by local assessors to be the total taxable value of land and additions on the property. | Land | Improvement |
|---|---|---|---|---|
| 2025 | $13,108 | $2,294,800 | $1,508,800 | $786,000 |
| 2024 | $13,108 | $2,299,700 | $1,508,800 | $790,900 |
| 2023 | $12,989 | $2,278,800 | $1,508,800 | $770,000 |
| 2022 | $12,791 | $2,244,100 | $1,508,800 | $735,300 |
| 2021 | $12,209 | $2,142,000 | $1,374,000 | $768,000 |
| 2020 | $12,188 | $2,138,200 | $1,374,000 | $764,200 |
| 2019 | $12,274 | $2,153,300 | $1,374,000 | $779,300 |
| 2018 | $11,330 | $1,987,800 | $1,210,100 | $777,700 |
| 2017 | $9,764 | $1,712,900 | $882,600 | $830,300 |
| 2016 | $9,756 | $1,711,500 | $882,600 | $828,900 |
| 2015 | $9,611 | $1,686,100 | $882,600 | $803,500 |
| 2014 | -- | $1,811,800 | $1,032,600 | $779,200 |
Source: Public Records
Map
Nearby Homes
- 42-103 Old Kalanianaole Rd
- 42-311 Old Kalanianaole Rd
- 133 Kahako St Unit A
- 322 Keolu Dr
- 1109 Akipohe St Unit 14C
- 42-100 Old Kalanianaole Rd Unit 8
- 1384 Nanawale Place
- 1318 Akele St
- 1233 Keolu Dr
- 1164 Manulani St
- 889 Akumu St
- 1227 Mowai St
- 1335 Onioni St
- 1214 Kina St
- 757 Akumu St
- 1450 Onioni St
- 599 Keolu Dr Unit B
- 1310 Hele St
- 41-1702 Kalanianaole Hwy
- 976 Kalawai Place Unit 4B
- 42-114 Aleka Place
- 42-115 Aleka Place
- 42-103 Aleka Place
- 42-100 Aleka Place
- 42-101 Aleka Place
- 42-32 Old Kalanianaole Rd
- 42-102 Aleka Place
- 42-102 Aleka Place Unit A
- 42-102 Aleka Place Unit B
- 42-110 Aleka Place
- 42-265 Old Kalanianaole Rd
- 1558 Akaakoa Place
- 1568 Keolu Dr
- 1557 Akaakoa Place
- 1556 Akaakoa Place
- 42-273 Old Kalanianaole Rd
- 1567 Keolu Dr
- 1547 Akahele Place
- 1548 Akahele Place
- 1564 Keolu Dr