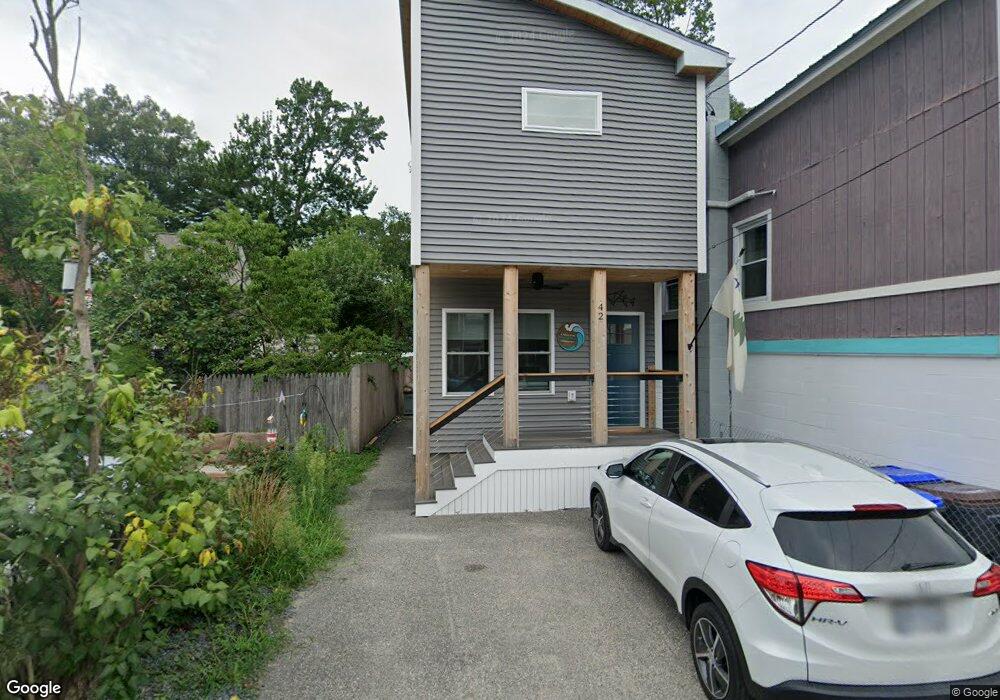
42 11th St Old Orchard Beach, ME 04064
Estimated Value: $326,000 - $397,000
2
Beds
1
Bath
585
Sq Ft
$622/Sq Ft
Est. Value
About This Home
This home is located at 42 11th St, Old Orchard Beach, ME 04064 and is currently estimated at $363,641, approximately $621 per square foot. 42 11th St is a home located in York County with nearby schools including Jameson Elementary School, Loranger Memorial School, and Old Orchard Beach High School.
Ownership History
Date
Name
Owned For
Owner Type
Purchase Details
Closed on
Jan 13, 2023
Sold by
Jac Nt and Priestley
Bought by
Two Tractor Guys Inc
Current Estimated Value
Home Financials for this Owner
Home Financials are based on the most recent Mortgage that was taken out on this home.
Original Mortgage
$245,000
Outstanding Balance
$236,741
Interest Rate
6.49%
Mortgage Type
Purchase Money Mortgage
Estimated Equity
$126,900
Purchase Details
Closed on
Jan 18, 2011
Sold by
Freese Linda A and Freese David P
Bought by
Golovin Meryl and Carlino Peter
Create a Home Valuation Report for This Property
The Home Valuation Report is an in-depth analysis detailing your home's value as well as a comparison with similar homes in the area
Home Values in the Area
Average Home Value in this Area
Purchase History
| Date | Buyer | Sale Price | Title Company |
|---|---|---|---|
| Two Tractor Guys Inc | $99,500 | None Available | |
| Golovin Meryl | -- | -- | |
| Golovin Meryl | -- | -- |
Source: Public Records
Mortgage History
| Date | Status | Borrower | Loan Amount |
|---|---|---|---|
| Open | Two Tractor Guys Inc | $245,000 |
Source: Public Records
Tax History Compared to Growth
Tax History
| Year | Tax Paid | Tax Assessment Tax Assessment Total Assessment is a certain percentage of the fair market value that is determined by local assessors to be the total taxable value of land and additions on the property. | Land | Improvement |
|---|---|---|---|---|
| 2024 | $2,501 | $229,900 | $63,400 | $166,500 |
| 2023 | $931 | $81,700 | $52,900 | $28,800 |
| 2022 | $1,272 | $103,900 | $46,000 | $57,900 |
| 2021 | $1,386 | $97,900 | $33,800 | $64,100 |
| 2020 | $1,523 | $98,800 | $30,700 | $68,100 |
| 2019 | $1,531 | $98,800 | $30,700 | $68,100 |
| 2018 | $1,466 | $95,800 | $29,100 | $66,700 |
| 2017 | $1,415 | $90,100 | $26,700 | $63,400 |
| 2016 | $1,314 | $85,000 | $21,600 | $63,400 |
| 2015 | $1,290 | $85,000 | $21,600 | $63,400 |
| 2014 | $1,324 | $89,000 | $25,600 | $63,400 |
| 2013 | $1,228 | $89,000 | $25,600 | $63,400 |
Source: Public Records
Map
Nearby Homes
- 29 15th St
- 113-115 Saco Ave
- 105 Union Ave
- 88 Union Ave Unit 301
- 3 Central Ave
- 88 Saco Ave Unit 1
- 161 Saco Ave Unit 113
- 43 Grove Ave
- 3 Arbutus Ave
- 9 Seaview Ave
- 9 Fern Ave
- 7 Heath St Unit 22
- 34 School St
- 16 Union Ave
- 3 Bay Ave Unit 23
- 4 Union Ave
- 5 4th Ave
- 1 Ocean Ave
- 39 W Grand Ave Unit 410
- 39 W Grand Ave Unit 510