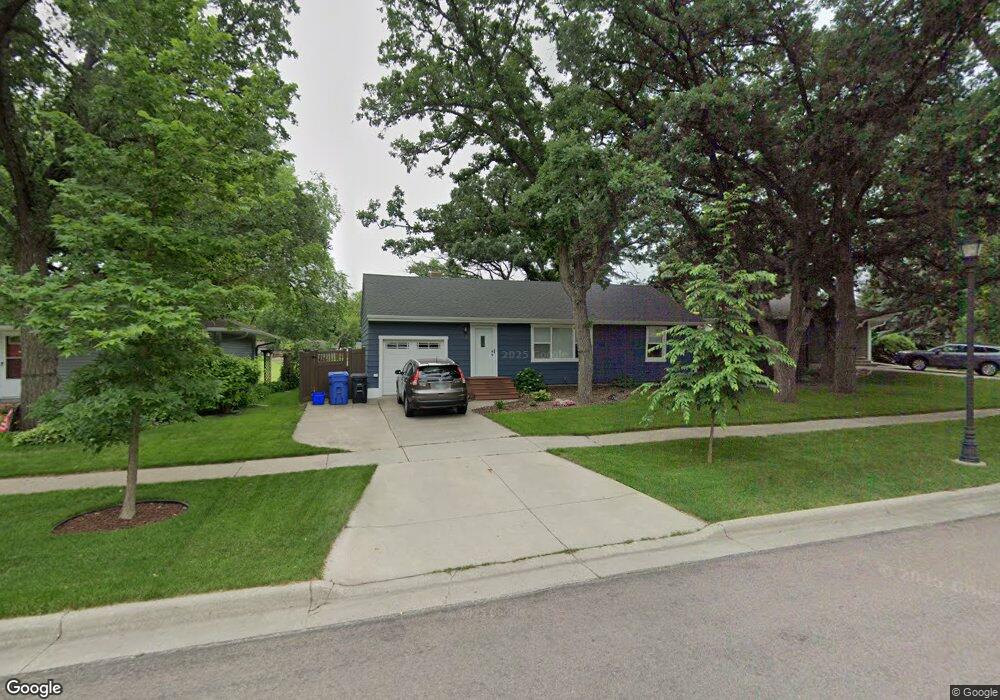
42 18th Ave N Fargo, ND 58102
Washington NeighborhoodEstimated Value: $263,000 - $326,000
3
Beds
1
Bath
936
Sq Ft
$317/Sq Ft
Est. Value
About This Home
This home is located at 42 18th Ave N, Fargo, ND 58102 and is currently estimated at $296,482, approximately $316 per square foot. 42 18th Ave N is a home located in Cass County with nearby schools including Washington Elementary School, Ben Franklin Middle School, and North High School.
Ownership History
Date
Name
Owned For
Owner Type
Purchase Details
Closed on
Jun 9, 2017
Sold by
Wynn George J and Wynn Kimberly
Bought by
Hauck Lisa M
Current Estimated Value
Home Financials for this Owner
Home Financials are based on the most recent Mortgage that was taken out on this home.
Original Mortgage
$197,910
Outstanding Balance
$134,832
Interest Rate
4.02%
Mortgage Type
New Conventional
Estimated Equity
$161,650
Create a Home Valuation Report for This Property
The Home Valuation Report is an in-depth analysis detailing your home's value as well as a comparison with similar homes in the area
Home Values in the Area
Average Home Value in this Area
Purchase History
| Date | Buyer | Sale Price | Title Company |
|---|---|---|---|
| Hauck Lisa M | $219,900 | Plains Title Llc |
Source: Public Records
Mortgage History
| Date | Status | Borrower | Loan Amount |
|---|---|---|---|
| Open | Hauck Lisa M | $197,910 |
Source: Public Records
Tax History Compared to Growth
Tax History
| Year | Tax Paid | Tax Assessment Tax Assessment Total Assessment is a certain percentage of the fair market value that is determined by local assessors to be the total taxable value of land and additions on the property. | Land | Improvement |
|---|---|---|---|---|
| 2024 | $3,645 | $136,300 | $31,750 | $104,550 |
| 2023 | $3,795 | $123,900 | $31,750 | $92,150 |
| 2022 | $3,630 | $115,800 | $31,750 | $84,050 |
| 2021 | $3,393 | $109,250 | $31,750 | $77,500 |
| 2020 | $3,274 | $106,200 | $31,750 | $74,450 |
| 2019 | $3,277 | $106,200 | $17,650 | $88,550 |
| 2018 | $2,508 | $78,000 | $17,650 | $60,350 |
| 2017 | $2,355 | $72,900 | $17,650 | $55,250 |
| 2016 | $2,043 | $66,250 | $17,650 | $48,600 |
| 2015 | $2,147 | $66,250 | $13,250 | $53,000 |
| 2014 | $2,263 | $69,100 | $13,250 | $55,850 |
| 2013 | $2,180 | $65,800 | $13,250 | $52,550 |
Source: Public Records
Map
Nearby Homes
- 111 19th Ave N
- 1822 3rd St N
- 1633 3rd St N
- 314 18th Ave N
- 305 19th Ave N
- 207 23rd Ave N
- 1645 Broadway N
- 3216 Broadway N
- 2510 Evergreen Rd N
- 1626 Broadway N
- 2512 2nd St N
- 418 25th Ave N
- 2411 Country Club Pkwy
- 101 27th Ave N
- 1437 Broadway N Unit 102
- 310 27th Ave N
- 87 28th Ave N
- 1914 9th St N
- 2807 Edgewood Dr N
- 1610 9th St N