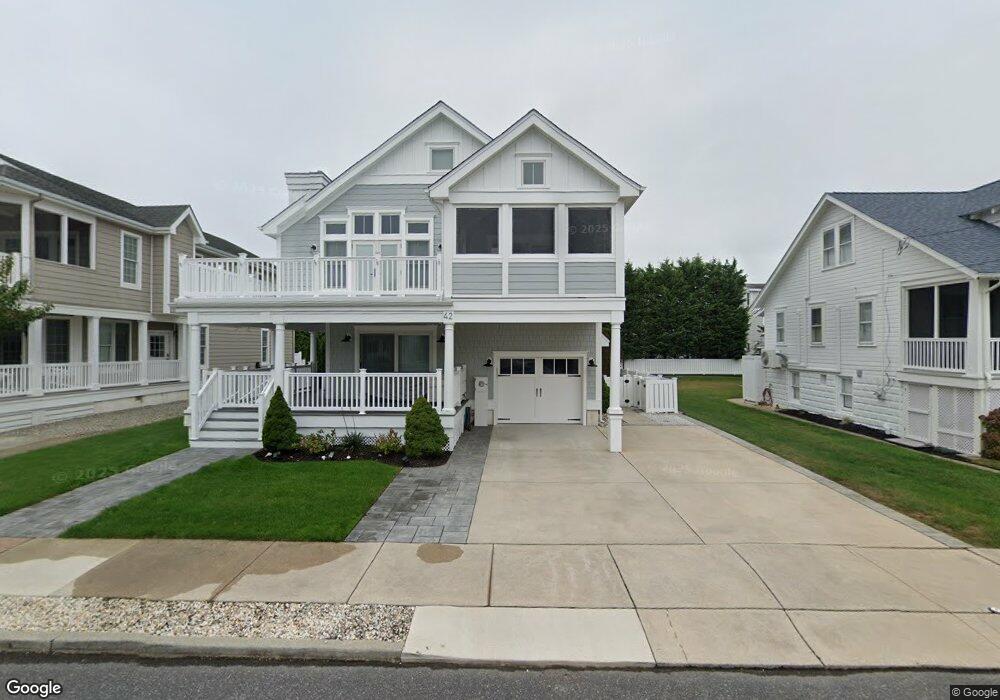
42 25th St W Avalon, NJ 08202
Estimated Value: $4,048,000 - $5,390,000
--
Bed
--
Bath
2,988
Sq Ft
$1,555/Sq Ft
Est. Value
About This Home
This home is located at 42 25th St W, Avalon, NJ 08202 and is currently estimated at $4,645,848, approximately $1,554 per square foot. 42 25th St W is a home located in Cape May County with nearby schools including Avalon Elementary School.
Ownership History
Date
Name
Owned For
Owner Type
Purchase Details
Closed on
Mar 3, 2011
Sold by
Saunders Joan H and Bartlett Thomas G
Bought by
Minetola Matthew and Minetola Michele L
Current Estimated Value
Home Financials for this Owner
Home Financials are based on the most recent Mortgage that was taken out on this home.
Original Mortgage
$385,000
Interest Rate
4.63%
Mortgage Type
New Conventional
Purchase Details
Closed on
Oct 16, 2009
Sold by
Estate Of Douglas M Saunders and Saunders Joan H
Bought by
Saunders Joan H and Bartlett Thomas G
Home Financials for this Owner
Home Financials are based on the most recent Mortgage that was taken out on this home.
Original Mortgage
$417,000
Interest Rate
5.06%
Mortgage Type
New Conventional
Create a Home Valuation Report for This Property
The Home Valuation Report is an in-depth analysis detailing your home's value as well as a comparison with similar homes in the area
Home Values in the Area
Average Home Value in this Area
Purchase History
| Date | Buyer | Sale Price | Title Company |
|---|---|---|---|
| Minetola Matthew | $1,400,000 | Fidelity Natl Title Ins Co | |
| Saunders Joan H | -- | None Available |
Source: Public Records
Mortgage History
| Date | Status | Borrower | Loan Amount |
|---|---|---|---|
| Previous Owner | Minetola Matthew | $385,000 | |
| Previous Owner | Saunders Joan H | $417,000 |
Source: Public Records
Tax History Compared to Growth
Tax History
| Year | Tax Paid | Tax Assessment Tax Assessment Total Assessment is a certain percentage of the fair market value that is determined by local assessors to be the total taxable value of land and additions on the property. | Land | Improvement |
|---|---|---|---|---|
| 2025 | $18,160 | $2,957,700 | $1,225,000 | $1,732,700 |
| 2024 | $18,160 | $2,957,700 | $1,225,000 | $1,732,700 |
| 2023 | $18,012 | $2,957,700 | $1,225,000 | $1,732,700 |
| 2022 | $10,659 | $1,876,600 | $1,225,000 | $651,600 |
| 2021 | $10,265 | $1,876,600 | $1,225,000 | $651,600 |
| 2020 | $9,871 | $1,876,600 | $1,225,000 | $651,600 |
| 2019 | $9,571 | $1,876,600 | $1,225,000 | $651,600 |
| 2018 | $9,158 | $1,876,600 | $1,225,000 | $651,600 |
| 2017 | $8,419 | $1,514,200 | $922,500 | $591,700 |
| 2016 | $8,328 | $1,514,200 | $922,500 | $591,700 |
| 2015 | $8,192 | $1,514,200 | $922,500 | $591,700 |
| 2014 | $8,101 | $1,514,200 | $922,500 | $591,700 |
Source: Public Records
Map
Nearby Homes
- 8 27th St Unit West
- 74 26th St E
- 29 28th St E Unit 7
- 53 25th St E
- 179 27th St
- 73 25th St E
- 161 24th St
- 83 25th St E
- 174 23rd St
- 2958 Avalon Ave
- 212 25th St
- 212 25th St Unit East Unit
- 2968 First Ave
- 2988 Avalon Ave
- 2988 1st Ave
- 76 21st St W
- 211 23rd St
- 3149 First Ave
- 55 32nd St W Unit C2B
- 25 32nd St W