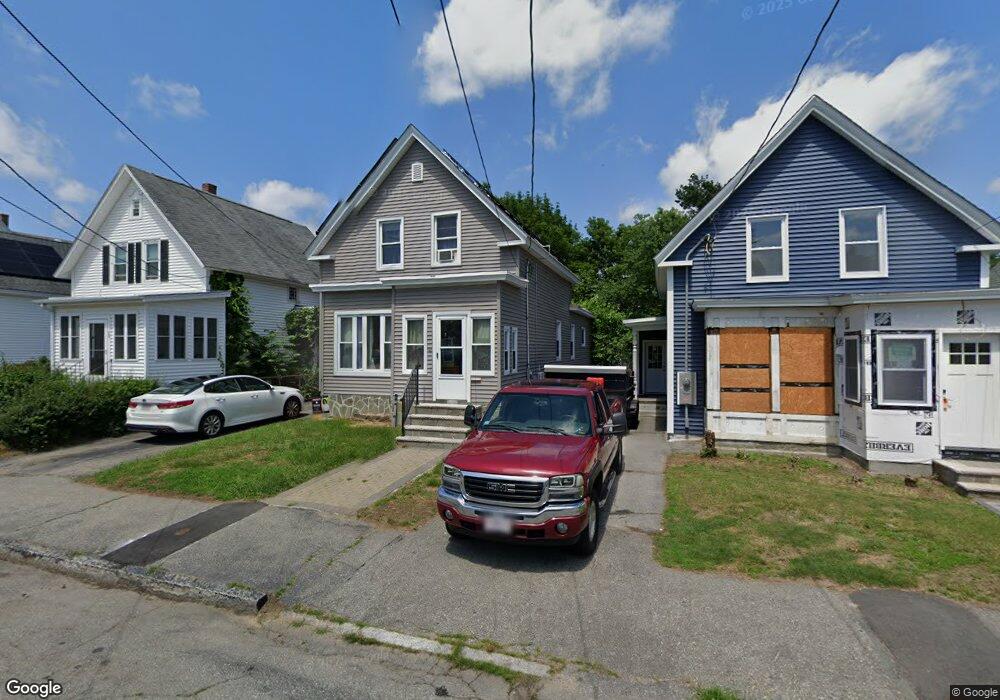
42 2nd Ave Lowell, MA 01854
Pawtucketville NeighborhoodEstimated Value: $460,000 - $565,000
3
Beds
1
Bath
1,434
Sq Ft
$353/Sq Ft
Est. Value
About This Home
This home is located at 42 2nd Ave, Lowell, MA 01854 and is currently estimated at $505,863, approximately $352 per square foot. 42 2nd Ave is a home located in Middlesex County with nearby schools including Joseph McAvinnue Elementary School, Charlotte M. Murkland Elementary School, and Charles W. Morey Elementary School.
Ownership History
Date
Name
Owned For
Owner Type
Purchase Details
Closed on
Aug 1, 2001
Sold by
Sawyer Richard M
Bought by
Clayton Anthony and Clayton Christina
Current Estimated Value
Home Financials for this Owner
Home Financials are based on the most recent Mortgage that was taken out on this home.
Original Mortgage
$152,605
Outstanding Balance
$58,130
Interest Rate
7.14%
Mortgage Type
Purchase Money Mortgage
Estimated Equity
$447,733
Create a Home Valuation Report for This Property
The Home Valuation Report is an in-depth analysis detailing your home's value as well as a comparison with similar homes in the area
Home Values in the Area
Average Home Value in this Area
Purchase History
| Date | Buyer | Sale Price | Title Company |
|---|---|---|---|
| Clayton Anthony | $155,000 | -- | |
| Clayton Anthony | $155,000 | -- |
Source: Public Records
Mortgage History
| Date | Status | Borrower | Loan Amount |
|---|---|---|---|
| Open | Clayton Anthony | $152,605 | |
| Closed | Clayton Anthony | $152,605 |
Source: Public Records
Tax History
| Year | Tax Paid | Tax Assessment Tax Assessment Total Assessment is a certain percentage of the fair market value that is determined by local assessors to be the total taxable value of land and additions on the property. | Land | Improvement |
|---|---|---|---|---|
| 2025 | $5,019 | $437,200 | $153,700 | $283,500 |
| 2024 | $4,778 | $401,200 | $134,100 | $267,100 |
| 2023 | $4,435 | $357,100 | $111,400 | $245,700 |
| 2022 | $4,127 | $325,200 | $101,300 | $223,900 |
| 2021 | $3,847 | $285,800 | $88,100 | $197,700 |
| 2020 | $3,607 | $270,000 | $82,300 | $187,700 |
| 2019 | $3,337 | $237,700 | $76,200 | $161,500 |
| 2018 | $3,179 | $220,900 | $72,600 | $148,300 |
| 2017 | $3,066 | $205,500 | $66,000 | $139,500 |
| 2016 | $2,773 | $182,900 | $55,300 | $127,600 |
| 2015 | $2,701 | $174,500 | $56,500 | $118,000 |
| 2013 | $2,603 | $173,400 | $69,800 | $103,600 |
Source: Public Records
Map
Nearby Homes
- 89 Mammoth Rd
- 30 4th Ave
- 79 School St Unit 4
- 28 Sarah Ave
- 244 White St
- 113 School St Unit 12
- 548 Fletcher St
- 57 Wannalancit St Unit 6
- 57 Wannalancit St Unit 11
- 39 Phoebe Ave
- 63 Bowers St
- 169 Salem St
- 15 Varney St
- 49 Sparks St
- 206 Cross St
- 70 Austin St Unit 15
- 2300 Skyline Dr Unit 3
- 1400 Skyline Dr Unit 6
- 15 Barbara St
- 94 Hampson St
Your Personal Tour Guide
Ask me questions while you tour the home.