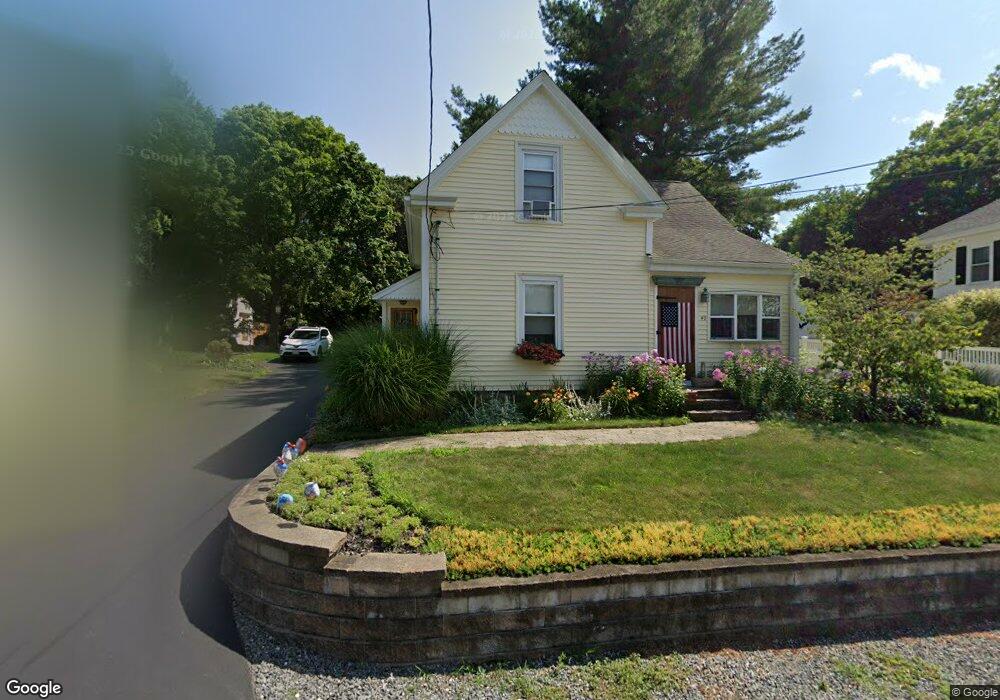
42 Adams Place South Weymouth, MA 02190
South Weymouth NeighborhoodEstimated Value: $554,000 - $656,000
4
Beds
1
Bath
1,540
Sq Ft
$402/Sq Ft
Est. Value
About This Home
This home is located at 42 Adams Place, South Weymouth, MA 02190 and is currently estimated at $618,319, approximately $401 per square foot. 42 Adams Place is a home located in Norfolk County with nearby schools including Thomas V Nash, Abigail Adams Middle School, and Weymouth Middle School Chapman.
Ownership History
Date
Name
Owned For
Owner Type
Purchase Details
Closed on
Oct 30, 2006
Sold by
Mcdonald Kenneth A and Shaw Jeanette T
Bought by
Green Kevin F and Green Florence
Current Estimated Value
Home Financials for this Owner
Home Financials are based on the most recent Mortgage that was taken out on this home.
Original Mortgage
$243,000
Outstanding Balance
$145,908
Interest Rate
6.48%
Mortgage Type
Purchase Money Mortgage
Estimated Equity
$472,411
Create a Home Valuation Report for This Property
The Home Valuation Report is an in-depth analysis detailing your home's value as well as a comparison with similar homes in the area
Home Values in the Area
Average Home Value in this Area
Purchase History
| Date | Buyer | Sale Price | Title Company |
|---|---|---|---|
| Green Kevin F | $270,000 | -- |
Source: Public Records
Mortgage History
| Date | Status | Borrower | Loan Amount |
|---|---|---|---|
| Open | Green Kevin F | $243,000 |
Source: Public Records
Tax History Compared to Growth
Tax History
| Year | Tax Paid | Tax Assessment Tax Assessment Total Assessment is a certain percentage of the fair market value that is determined by local assessors to be the total taxable value of land and additions on the property. | Land | Improvement |
|---|---|---|---|---|
| 2025 | $5,099 | $504,900 | $198,300 | $306,600 |
| 2024 | $4,638 | $451,600 | $188,900 | $262,700 |
| 2023 | $4,666 | $446,500 | $192,400 | $254,100 |
| 2022 | $4,554 | $397,400 | $178,100 | $219,300 |
| 2021 | $4,162 | $354,500 | $178,100 | $176,400 |
| 2020 | $3,963 | $332,500 | $178,100 | $154,400 |
| 2019 | $3,867 | $319,100 | $171,300 | $147,800 |
| 2018 | $3,660 | $292,800 | $155,700 | $137,100 |
| 2017 | $3,498 | $273,100 | $148,300 | $124,800 |
| 2016 | $3,361 | $262,600 | $142,600 | $120,000 |
| 2015 | $3,250 | $251,900 | $142,600 | $109,300 |
| 2014 | $3,112 | $234,000 | $132,700 | $101,300 |
Source: Public Records
Map
Nearby Homes
- 27 Park Ave
- 2 Mitchell Ln Unit B
- 20 Wilbur St
- 24 Fisher Rd
- 261 Pleasant St Unit 3
- 261 Pleasant St Unit 5
- 16 Jay Rd
- 92 Mercury St
- 18 Fountain Ln Unit 2
- 308 Forest St
- 17 Berean Way
- 193 Randolph St
- 120 Burkhall St Unit K
- 262 West St
- 255 West St
- 211 Randolph St
- 376 Pleasant St
- 60 Greentree Ln Unit 38
- 110 Burkhall St Unit H
- 68 Massapoag St Unit 7