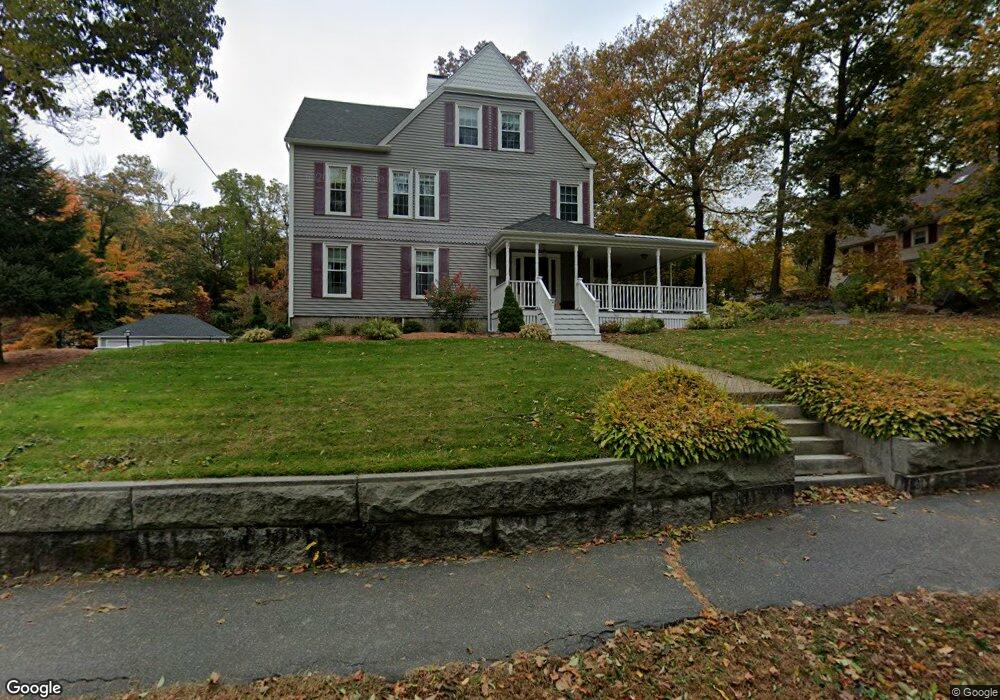
42 Adin St Unit 42 Hopedale, MA 01747
Estimated Value: $851,000 - $1,042,000
6
Beds
5
Baths
3,800
Sq Ft
$241/Sq Ft
Est. Value
About This Home
This home is located at 42 Adin St Unit 42, Hopedale, MA 01747 and is currently estimated at $917,132, approximately $241 per square foot. 42 Adin St Unit 42 is a home located in Worcester County with nearby schools including Memorial Elementary School, Hopedale Jr Sr High School, and Bethany Christian Academy.
Ownership History
Date
Name
Owned For
Owner Type
Purchase Details
Closed on
Jan 3, 2017
Sold by
Bennett Barry
Bought by
Savage Elizabeth
Current Estimated Value
Home Financials for this Owner
Home Financials are based on the most recent Mortgage that was taken out on this home.
Original Mortgage
$424,100
Outstanding Balance
$347,687
Interest Rate
3.94%
Mortgage Type
Unknown
Estimated Equity
$569,445
Purchase Details
Closed on
Feb 15, 2008
Sold by
Jada Group Llc and Bennett Barry
Bought by
Dubois John D and Dubois Lisa A
Purchase Details
Closed on
Oct 15, 2007
Sold by
Milanoski Anthony F and Milanoski Dorothy C
Bought by
Jada Group Llc and Bennett Barry
Home Financials for this Owner
Home Financials are based on the most recent Mortgage that was taken out on this home.
Original Mortgage
$300,000
Interest Rate
6.49%
Mortgage Type
Purchase Money Mortgage
Create a Home Valuation Report for This Property
The Home Valuation Report is an in-depth analysis detailing your home's value as well as a comparison with similar homes in the area
Home Values in the Area
Average Home Value in this Area
Purchase History
| Date | Buyer | Sale Price | Title Company |
|---|---|---|---|
| Savage Elizabeth | $536,250 | -- | |
| Dubois John D | $7,000 | -- | |
| Jada Group Llc | $430,000 | -- |
Source: Public Records
Mortgage History
| Date | Status | Borrower | Loan Amount |
|---|---|---|---|
| Open | Savage Elizabeth | $424,100 | |
| Previous Owner | Jada Group Llc | $300,000 |
Source: Public Records
Tax History Compared to Growth
Tax History
| Year | Tax Paid | Tax Assessment Tax Assessment Total Assessment is a certain percentage of the fair market value that is determined by local assessors to be the total taxable value of land and additions on the property. | Land | Improvement |
|---|---|---|---|---|
| 2025 | $12,584 | $757,600 | $231,700 | $525,900 |
| 2024 | $12,022 | $724,200 | $220,900 | $503,300 |
| 2023 | $10,853 | $672,000 | $217,600 | $454,400 |
| 2022 | $10,584 | $618,600 | $199,400 | $419,200 |
| 2021 | $6,828 | $567,100 | $181,300 | $385,800 |
| 2020 | $74 | $567,100 | $181,300 | $385,800 |
| 2019 | $9,302 | $529,400 | $181,300 | $348,100 |
| 2018 | $1,303 | $520,200 | $181,300 | $338,900 |
| 2017 | $9,395 | $543,400 | $181,300 | $362,100 |
| 2016 | $9,036 | $536,900 | $181,300 | $355,600 |
| 2015 | $8,590 | $518,100 | $181,300 | $336,800 |
Source: Public Records
Map
Nearby Homes