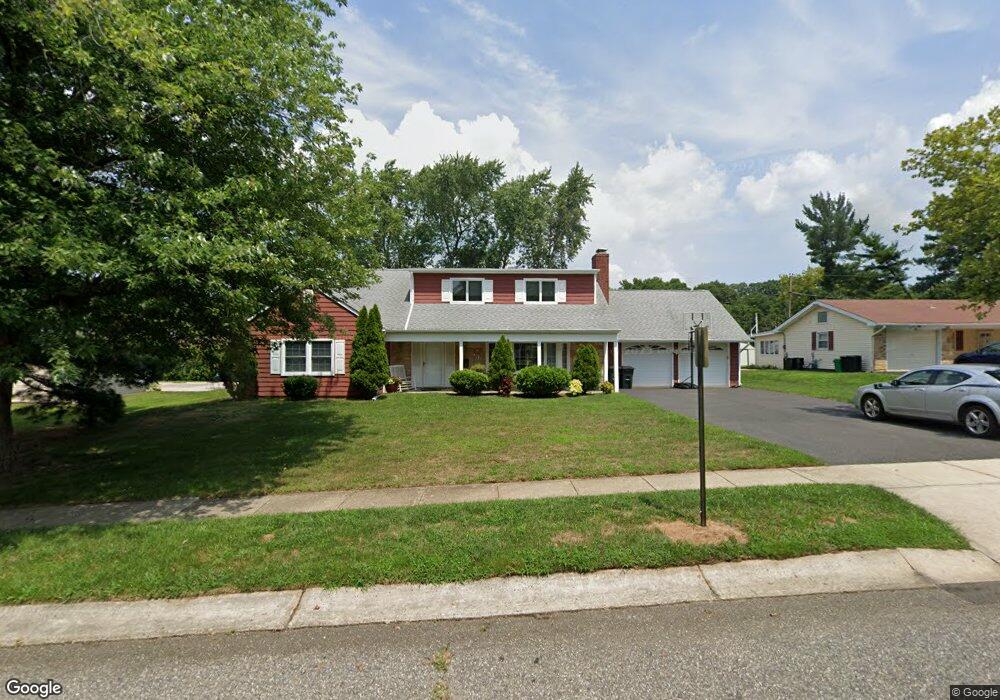
42 Autumn Ln Matawan, NJ 07747
Estimated Value: $778,000 - $852,000
5
Beds
3
Baths
2,370
Sq Ft
$342/Sq Ft
Est. Value
About This Home
This home is located at 42 Autumn Ln, Matawan, NJ 07747 and is currently estimated at $810,736, approximately $342 per square foot. 42 Autumn Ln is a home located in Monmouth County with nearby schools including Matawan Reg High School, St Benedict School, and St. Joseph Elementary School.
Ownership History
Date
Name
Owned For
Owner Type
Purchase Details
Closed on
Jul 18, 2003
Sold by
Colbert Edward
Bought by
Costello Brian and Costello Jennifer
Current Estimated Value
Home Financials for this Owner
Home Financials are based on the most recent Mortgage that was taken out on this home.
Original Mortgage
$225,000
Interest Rate
6.02%
Purchase Details
Closed on
Jun 15, 2000
Sold by
Wauters Karin
Bought by
Colbert Edward and Colbert Lynn
Home Financials for this Owner
Home Financials are based on the most recent Mortgage that was taken out on this home.
Original Mortgage
$153,000
Interest Rate
8.55%
Purchase Details
Closed on
Nov 22, 1995
Sold by
Bell Marjorie Stanwood
Bought by
Wauters Karin and Wauters Helen
Home Financials for this Owner
Home Financials are based on the most recent Mortgage that was taken out on this home.
Original Mortgage
$128,000
Interest Rate
7.37%
Create a Home Valuation Report for This Property
The Home Valuation Report is an in-depth analysis detailing your home's value as well as a comparison with similar homes in the area
Home Values in the Area
Average Home Value in this Area
Purchase History
| Date | Buyer | Sale Price | Title Company |
|---|---|---|---|
| Costello Brian | $377,500 | -- | |
| Colbert Edward | $239,000 | -- | |
| Wauters Karin | $160,000 | -- |
Source: Public Records
Mortgage History
| Date | Status | Borrower | Loan Amount |
|---|---|---|---|
| Previous Owner | Costello Brian | $225,000 | |
| Previous Owner | Colbert Edward | $153,000 | |
| Previous Owner | Wauters Karin | $128,000 |
Source: Public Records
Tax History Compared to Growth
Tax History
| Year | Tax Paid | Tax Assessment Tax Assessment Total Assessment is a certain percentage of the fair market value that is determined by local assessors to be the total taxable value of land and additions on the property. | Land | Improvement |
|---|---|---|---|---|
| 2025 | $12,328 | $679,800 | $421,000 | $258,800 |
| 2024 | $11,936 | $610,000 | $356,000 | $254,000 |
| 2023 | $11,936 | $558,000 | $309,900 | $248,100 |
| 2022 | $11,634 | $479,100 | $242,900 | $236,200 |
| 2021 | $11,634 | $430,400 | $220,300 | $210,100 |
| 2020 | $11,811 | $435,200 | $229,800 | $205,400 |
| 2019 | $11,754 | $420,700 | $216,500 | $204,200 |
| 2018 | $11,234 | $403,100 | $208,400 | $194,700 |
| 2017 | $10,863 | $395,300 | $189,400 | $205,900 |
| 2016 | $10,121 | $384,400 | $183,700 | $200,700 |
| 2015 | $10,585 | $385,900 | $190,400 | $195,500 |
| 2014 | $10,117 | $376,100 | $181,800 | $194,300 |
Source: Public Records
Map
Nearby Homes