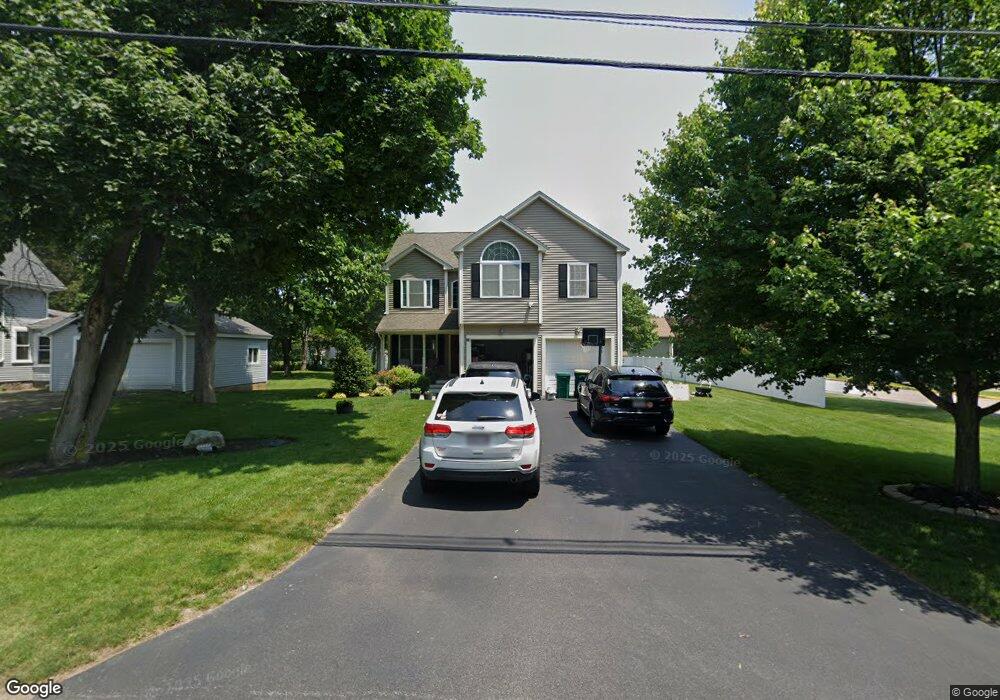
42 Baldwin St North Easton, MA 02356
Estimated Value: $604,000 - $917,000
2
Beds
1
Bath
790
Sq Ft
$1,033/Sq Ft
Est. Value
About This Home
This home is located at 42 Baldwin St, North Easton, MA 02356 and is currently estimated at $815,879, approximately $1,032 per square foot. 42 Baldwin St is a home located in Bristol County with nearby schools including Easton Middle School.
Ownership History
Date
Name
Owned For
Owner Type
Purchase Details
Closed on
Nov 23, 2010
Sold by
Travers Tr John J and Calderaro Lucille C
Bought by
Powers Kevin M and Powers Nicole R
Current Estimated Value
Home Financials for this Owner
Home Financials are based on the most recent Mortgage that was taken out on this home.
Original Mortgage
$332,000
Interest Rate
4.3%
Mortgage Type
Purchase Money Mortgage
Create a Home Valuation Report for This Property
The Home Valuation Report is an in-depth analysis detailing your home's value as well as a comparison with similar homes in the area
Home Values in the Area
Average Home Value in this Area
Purchase History
| Date | Buyer | Sale Price | Title Company |
|---|---|---|---|
| Powers Kevin M | $130,000 | -- | |
| Powers Kevin M | $130,000 | -- |
Source: Public Records
Mortgage History
| Date | Status | Borrower | Loan Amount |
|---|---|---|---|
| Open | Powers Kevin M | $366,600 | |
| Closed | Powers Kevin M | $25,400 | |
| Closed | Powers Kevin M | $373,000 | |
| Closed | Powers Kevin M | $332,000 | |
| Closed | Powers Kevin M | $41,500 |
Source: Public Records
Tax History Compared to Growth
Tax History
| Year | Tax Paid | Tax Assessment Tax Assessment Total Assessment is a certain percentage of the fair market value that is determined by local assessors to be the total taxable value of land and additions on the property. | Land | Improvement |
|---|---|---|---|---|
| 2025 | $9,585 | $768,000 | $305,300 | $462,700 |
| 2024 | $9,535 | $714,200 | $251,500 | $462,700 |
| 2023 | $8,966 | $614,500 | $251,500 | $363,000 |
| 2022 | $8,917 | $579,400 | $229,800 | $349,600 |
| 2021 | $8,690 | $561,400 | $218,500 | $342,900 |
| 2020 | $8,347 | $542,700 | $209,700 | $333,000 |
| 2019 | $8,259 | $517,500 | $184,300 | $333,200 |
| 2018 | $7,886 | $486,500 | $174,400 | $312,100 |
| 2017 | $7,549 | $465,400 | $174,400 | $291,000 |
| 2016 | $7,051 | $435,500 | $158,500 | $277,000 |
| 2015 | $7,298 | $434,900 | $157,900 | $277,000 |
| 2014 | $6,795 | $408,100 | $134,600 | $273,500 |
Source: Public Records
Map
Nearby Homes
- 56 Williams St
- 32 Spooner St
- 67 Center St
- 221 Center St
- 225 Main St
- 224 Main St
- 7 Coolidge Cir
- 24 Eisenhower Dr
- 334-336 Main St
- 11 Olde Stable Ln
- 8 Hobart Way
- 21 Scotch Dam Rd
- 73 Summer St
- 280 Washington St
- 79 Summer St
- 18 Prudence Crandall Ln Unit 18
- 45 Randall St
- 1 Whittier Ln Unit 1
- 15 King Ave
- 9 Oak Ridge Dr