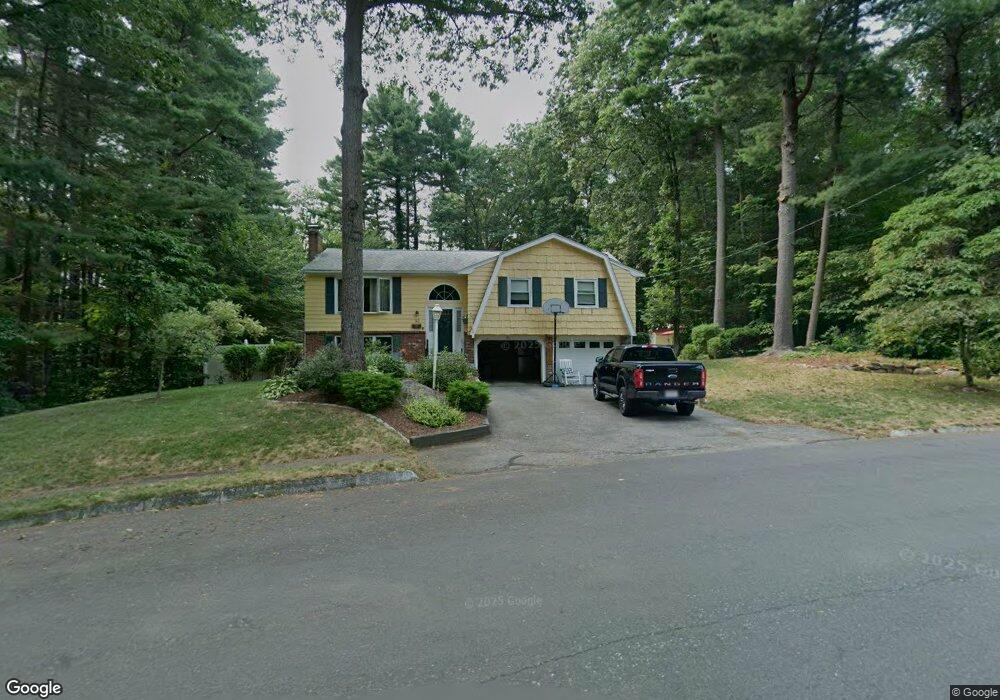
42 Barton Rd Foxboro, MA 02035
Estimated Value: $603,392 - $733,000
3
Beds
2
Baths
1,350
Sq Ft
$502/Sq Ft
Est. Value
About This Home
This home is located at 42 Barton Rd, Foxboro, MA 02035 and is currently estimated at $677,098, approximately $501 per square foot. 42 Barton Rd is a home located in Norfolk County with nearby schools including Foxborough High School, Discovery Daycare Center, and Hands-On-Montessori School.
Ownership History
Date
Name
Owned For
Owner Type
Purchase Details
Closed on
Sep 13, 2021
Sold by
Brolin Christopher F and Brolin Marion L
Bought by
Brolin Ret
Current Estimated Value
Purchase Details
Closed on
Nov 25, 1996
Sold by
Mcinnes John A and Mcinnes Laura W
Bought by
Brolin Christopher and Brolin Marion L
Purchase Details
Closed on
Jan 28, 1992
Sold by
Shorrock Arnold L and Shorrock Julie F
Bought by
Mcinnes John A and Mcinnes Laura W
Create a Home Valuation Report for This Property
The Home Valuation Report is an in-depth analysis detailing your home's value as well as a comparison with similar homes in the area
Home Values in the Area
Average Home Value in this Area
Purchase History
| Date | Buyer | Sale Price | Title Company |
|---|---|---|---|
| Brolin Ret | -- | None Available | |
| Brolin Christopher | $172,000 | -- | |
| Mcinnes John A | $167,000 | -- |
Source: Public Records
Mortgage History
| Date | Status | Borrower | Loan Amount |
|---|---|---|---|
| Previous Owner | Mcinnes John A | $178,000 | |
| Previous Owner | Mcinnes John A | $205,000 | |
| Previous Owner | Mcinnes John A | $35,000 |
Source: Public Records
Tax History
| Year | Tax Paid | Tax Assessment Tax Assessment Total Assessment is a certain percentage of the fair market value that is determined by local assessors to be the total taxable value of land and additions on the property. | Land | Improvement |
|---|---|---|---|---|
| 2025 | $7,245 | $548,000 | $247,300 | $300,700 |
| 2024 | $6,927 | $512,700 | $251,800 | $260,900 |
| 2023 | $6,726 | $473,300 | $239,700 | $233,600 |
| 2022 | $6,125 | $421,800 | $201,000 | $220,800 |
| 2021 | $5,715 | $387,700 | $186,100 | $201,600 |
| 2020 | $5,334 | $366,100 | $186,100 | $180,000 |
| 2019 | $5,208 | $354,300 | $177,300 | $177,000 |
| 2018 | $5,050 | $348,100 | $177,300 | $170,800 |
| 2017 | $5,050 | $335,800 | $165,600 | $170,200 |
| 2016 | $5,117 | $345,300 | $167,100 | $178,200 |
| 2015 | $4,903 | $322,800 | $141,300 | $181,500 |
| 2014 | $4,699 | $313,500 | $132,000 | $181,500 |
Source: Public Records
Map
Nearby Homes
- 128 Tremont St
- 25 Shepherd St
- 1769 West St
- 346 South St
- 24 Maverick Dr
- 40 Treasure Island Rd
- 16 Treasure Island Rd
- 33 Colonial Way
- 9 Coach Rd
- 84 Messenger St
- 46 Mirimichi St
- 150 Gilbert St
- 14 Claire Ave
- 356 Central St
- 155 South St
- 25 Munroe Dr
- 166 Chauncy St
- 28 Messenger St
- 126 Washington St
- 130 Washington St
Your Personal Tour Guide
Ask me questions while you tour the home.