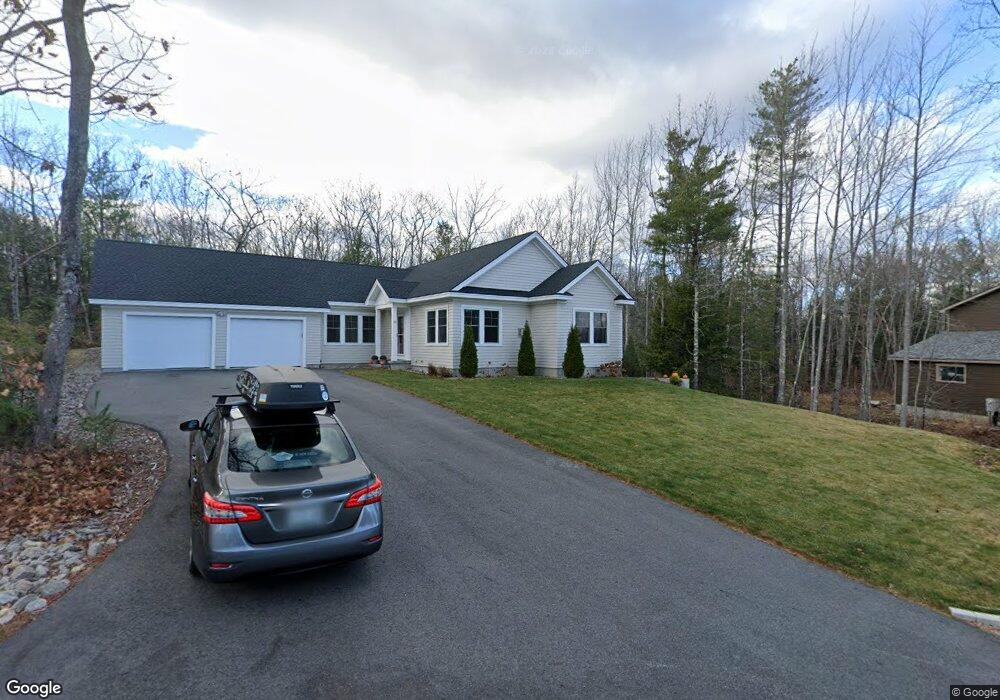
42 Blandings Way Biddeford, ME 04005
South Biddeford NeighborhoodEstimated Value: $656,000 - $904,000
3
Beds
3
Baths
2,187
Sq Ft
$341/Sq Ft
Est. Value
About This Home
This home is located at 42 Blandings Way, Biddeford, ME 04005 and is currently estimated at $745,164, approximately $340 per square foot. 42 Blandings Way is a home with nearby schools including John F Kennedy Memorial School, Biddeford Primary School, and Biddeford Intermediate School.
Ownership History
Date
Name
Owned For
Owner Type
Purchase Details
Closed on
Jan 15, 2021
Sold by
Southern Coast Dev Inc
Bought by
Conrad Eric and Walsh Barbara
Current Estimated Value
Home Financials for this Owner
Home Financials are based on the most recent Mortgage that was taken out on this home.
Original Mortgage
$95,000
Outstanding Balance
$84,788
Interest Rate
2.71%
Mortgage Type
Purchase Money Mortgage
Estimated Equity
$660,376
Create a Home Valuation Report for This Property
The Home Valuation Report is an in-depth analysis detailing your home's value as well as a comparison with similar homes in the area
Home Values in the Area
Average Home Value in this Area
Purchase History
| Date | Buyer | Sale Price | Title Company |
|---|---|---|---|
| Conrad Eric | -- | None Available | |
| Conrad Eric | -- | None Available |
Source: Public Records
Mortgage History
| Date | Status | Borrower | Loan Amount |
|---|---|---|---|
| Open | Conrad Eric | $95,000 | |
| Closed | Conrad Eric | $95,000 |
Source: Public Records
Tax History Compared to Growth
Tax History
| Year | Tax Paid | Tax Assessment Tax Assessment Total Assessment is a certain percentage of the fair market value that is determined by local assessors to be the total taxable value of land and additions on the property. | Land | Improvement |
|---|---|---|---|---|
| 2024 | $8,593 | $604,300 | $182,100 | $422,200 |
| 2023 | $7,889 | $601,300 | $179,100 | $422,200 |
| 2022 | $8,789 | $535,600 | $102,800 | $432,800 |
| 2021 | $1,373 | $75,300 | $75,300 | $0 |
| 2020 | $1,329 | $66,300 | $66,300 | $0 |
| 2019 | $1,325 | $66,300 | $66,300 | $0 |
| 2018 | $1,306 | $66,300 | $66,300 | $0 |
| 2017 | $1,331 | $66,300 | $66,300 | $0 |
| 2016 | $1,317 | $66,300 | $66,300 | $0 |
| 2015 | $1,291 | $66,300 | $66,300 | $0 |
| 2014 | $1,111 | $58,500 | $58,500 | $0 |
| 2013 | -- | $61,600 | $61,600 | $0 |
Source: Public Records
Map
Nearby Homes
- 353 Pool St
- 378 Pool St
- 21 Glenhaven Cir W
- 15 Thunder Rd
- 38 Pine Ridge Rd
- 5 Quarry Ln
- TBD 530 Ferry Rd
- 2 Breakwater Way Unit 2
- 5 Moxie Ln
- 3 Moxie Ln
- 625,650 Pool St
- 6 Tide Water Dr
- 19 Ocean Greens Dr
- 147 Cleaves St Unit 3
- 20 Clifford St
- 26 Ocean Greens Dr
- 276 West St
- 30 Plymouth Dr
- 21 Old Orchard Rd
- 4 Mainsail Ln Unit 4