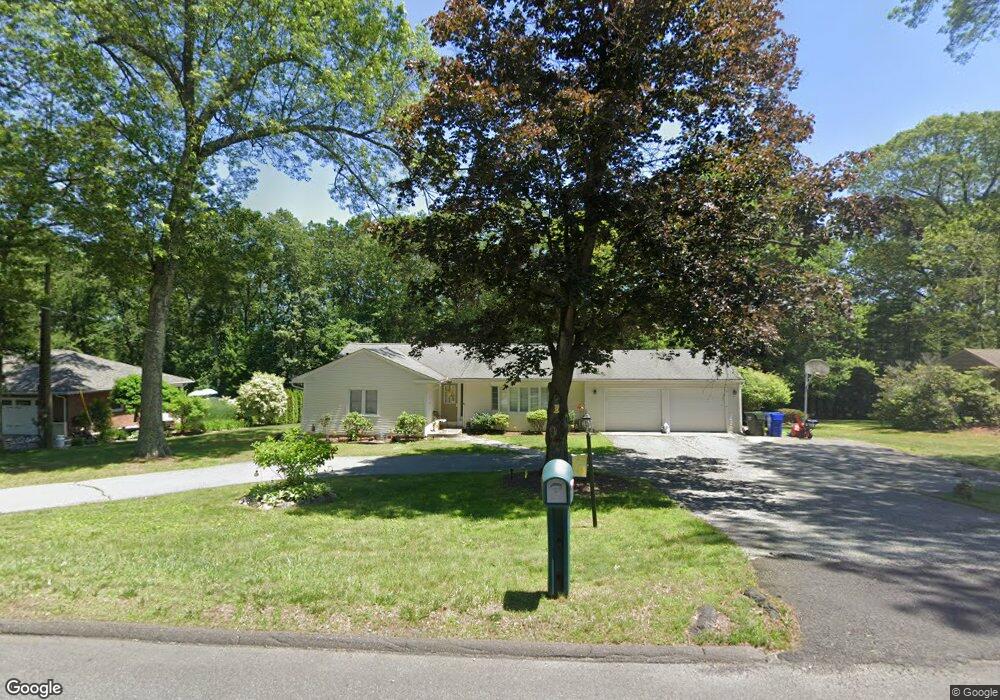
42 Brainard Rd Wilbraham, MA 01095
Estimated Value: $370,889 - $440,000
3
Beds
2
Baths
1,710
Sq Ft
$241/Sq Ft
Est. Value
About This Home
This home is located at 42 Brainard Rd, Wilbraham, MA 01095 and is currently estimated at $411,472, approximately $240 per square foot. 42 Brainard Rd is a home located in Hampden County with nearby schools including Minnechaug Regional High School and St John The Baptist School.
Ownership History
Date
Name
Owned For
Owner Type
Purchase Details
Closed on
Sep 2, 2011
Sold by
Fhlmc
Bought by
Kuselias Peter and Kuselias Jeffrey
Current Estimated Value
Purchase Details
Closed on
Aug 25, 2011
Sold by
Kielbania Kori K and Wells Fargo Bank Na
Bought by
Fhlmc
Purchase Details
Closed on
Jul 25, 2006
Sold by
Sherman Dale R and Walker-Sherman Jean M
Bought by
Kielbania Kori K
Home Financials for this Owner
Home Financials are based on the most recent Mortgage that was taken out on this home.
Original Mortgage
$204,000
Interest Rate
6.67%
Mortgage Type
Purchase Money Mortgage
Purchase Details
Closed on
Apr 16, 1996
Sold by
Wrisley David E and Wrisley Lisa A
Bought by
Sherman Dale R and Walker-Sherman Jean M
Purchase Details
Closed on
Feb 10, 1988
Sold by
Libiszewski Daniel
Bought by
Wrisley David E
Create a Home Valuation Report for This Property
The Home Valuation Report is an in-depth analysis detailing your home's value as well as a comparison with similar homes in the area
Home Values in the Area
Average Home Value in this Area
Purchase History
| Date | Buyer | Sale Price | Title Company |
|---|---|---|---|
| Kuselias Peter | $155,500 | -- | |
| Fhlmc | $216,557 | -- | |
| Kielbania Kori K | $255,000 | -- | |
| Sherman Dale R | $145,000 | -- | |
| Wrisley David E | $139,900 | -- |
Source: Public Records
Mortgage History
| Date | Status | Borrower | Loan Amount |
|---|---|---|---|
| Previous Owner | Kielbania Kori K | $204,000 | |
| Previous Owner | Wrisley David E | $65,800 | |
| Previous Owner | Wrisley David E | $22,000 | |
| Previous Owner | Wrisley David E | $15,000 |
Source: Public Records
Tax History
| Year | Tax Paid | Tax Assessment Tax Assessment Total Assessment is a certain percentage of the fair market value that is determined by local assessors to be the total taxable value of land and additions on the property. | Land | Improvement |
|---|---|---|---|---|
| 2025 | $5,947 | $332,600 | $79,400 | $253,200 |
| 2024 | $5,137 | $277,700 | $79,400 | $198,300 |
| 2023 | $4,668 | $259,700 | $79,400 | $180,300 |
| 2022 | $4,668 | $227,800 | $79,400 | $148,400 |
| 2021 | $4,346 | $189,300 | $85,300 | $104,000 |
| 2020 | $4,237 | $189,300 | $85,300 | $104,000 |
| 2019 | $4,127 | $189,300 | $85,300 | $104,000 |
| 2018 | $3,928 | $173,500 | $85,300 | $88,200 |
| 2017 | $3,817 | $173,500 | $85,300 | $88,200 |
| 2016 | $3,832 | $177,400 | $94,800 | $82,600 |
| 2015 | $3,704 | $177,400 | $94,800 | $82,600 |
Source: Public Records
Map
Nearby Homes
- 3 Mohawk St
- 22 Brainard Rd
- 24 Lodge Ln Unit 24
- 2205 Boston Rd Unit E43
- 2205 Boston Rd Unit M120
- 6 Teak Terrace Unit 24
- 57 Sandalwood Dr Unit site 61
- 111 Sandalwood Dr Unit site 00
- 84 Sandalwood Dr Unit site 00
- 103 Sandalwood Dr Unit site 00
- 26 Sandalwood Dr
- 46 Washington Rd
- 6V Melikian Dr
- 144 Stony Hill Rd
- 4 Hillcrest Dr
- 35 Lake Dr
- 24 Dumaine St
- 37 Franklin St
- 104 High Pine Cir
- 25 Dale St
- 40 Brainard Rd
- 44 Brainard Rd
- 201 Manchonis rd Extension
- 38 Brainard Rd
- 43 Brainard Rd
- 207 Manchonis rd Extension
- 41 Brainard Rd
- 207 Manchonis rd Extension
- 207 MacHonis Rd Extension
- 46 Brainard Rd
- 36 Brainard Rd
- 21 Linwood Dr
- 200 Manchonis rd Extension
- 37 Brainard Rd
- 47 Brainard Rd
- 211 Manchonis rd Extension
- 48 Brainard Rd
- 34 Brainard Rd
- 212 Manchonis Rd
- 212 Manchonis rd Extension
Your Personal Tour Guide
Ask me questions while you tour the home.