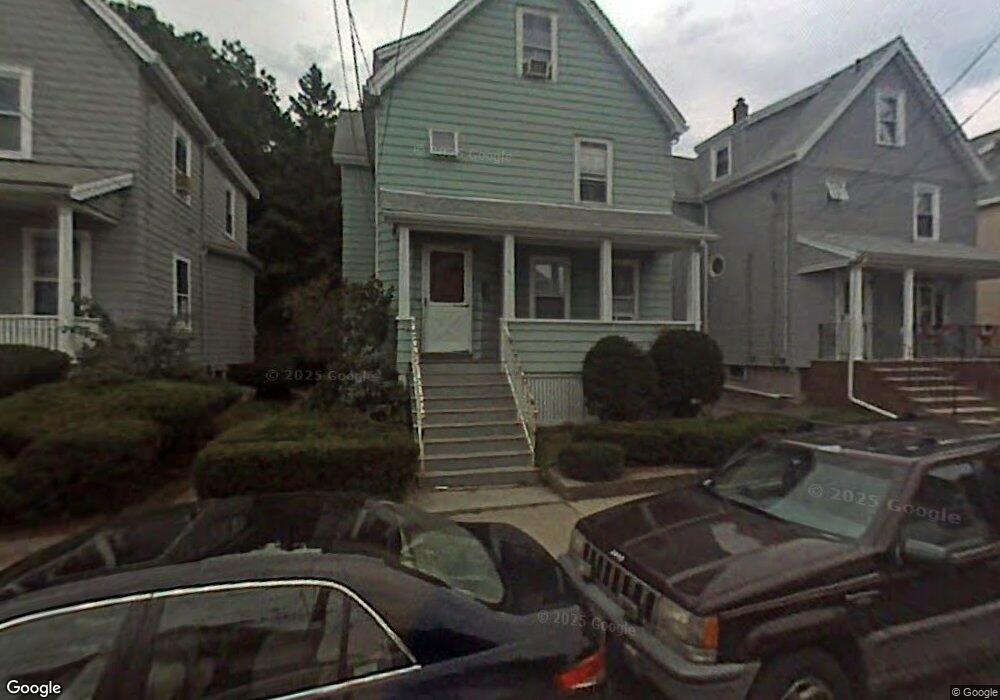
42 Cedar St Everett, MA 02149
Glendale NeighborhoodEstimated Value: $626,936 - $723,000
4
Beds
1
Bath
1,486
Sq Ft
$453/Sq Ft
Est. Value
About This Home
This home is located at 42 Cedar St, Everett, MA 02149 and is currently estimated at $672,734, approximately $452 per square foot. 42 Cedar St is a home located in Middlesex County with nearby schools including Everett High School and Cheverus Centennial School.
Ownership History
Date
Name
Owned For
Owner Type
Purchase Details
Closed on
Oct 4, 2021
Sold by
Griffin Rene T
Bought by
Griffin Ft
Current Estimated Value
Purchase Details
Closed on
May 11, 2020
Sold by
Griffin Edward J
Bought by
Griffin Rene T
Purchase Details
Closed on
Jan 1, 1967
Bought by
Griffin Edward J and Griffin Rene T
Create a Home Valuation Report for This Property
The Home Valuation Report is an in-depth analysis detailing your home's value as well as a comparison with similar homes in the area
Home Values in the Area
Average Home Value in this Area
Purchase History
| Date | Buyer | Sale Price | Title Company |
|---|---|---|---|
| Griffin Ft | -- | None Available | |
| Griffin Rene T | -- | None Available | |
| Griffin Edward J | -- | -- |
Source: Public Records
Mortgage History
| Date | Status | Borrower | Loan Amount |
|---|---|---|---|
| Previous Owner | Griffin Edward J | $65,000 | |
| Previous Owner | Griffin Edward J | $40,000 | |
| Previous Owner | Griffin Edward J | $40,000 |
Source: Public Records
Tax History
| Year | Tax Paid | Tax Assessment Tax Assessment Total Assessment is a certain percentage of the fair market value that is determined by local assessors to be the total taxable value of land and additions on the property. | Land | Improvement |
|---|---|---|---|---|
| 2025 | $6,554 | $575,400 | $254,900 | $320,500 |
| 2024 | $5,968 | $520,800 | $226,600 | $294,200 |
| 2023 | $5,710 | $484,700 | $207,700 | $277,000 |
| 2022 | $4,701 | $453,800 | $198,300 | $255,500 |
| 2021 | $4,104 | $415,800 | $177,500 | $238,300 |
| 2020 | $4,378 | $411,500 | $177,500 | $234,000 |
| 2019 | $4,631 | $374,100 | $169,000 | $205,100 |
| 2018 | $4,480 | $325,100 | $147,300 | $177,800 |
| 2017 | $3,945 | $273,200 | $113,300 | $159,900 |
| 2016 | $3,852 | $266,600 | $113,300 | $153,300 |
| 2015 | $3,692 | $252,700 | $106,500 | $146,200 |
Source: Public Records
Map
Nearby Homes
- 13 Coolidge St
- 19 Mills St
- 132 Vernal St
- 21 Central Ave Unit 10
- 21 Staples Ave Unit 26
- 15 Staples Ave Unit 45
- 15 Staples Ave Unit 31
- 210 Hancock St
- 378 Ferry St
- 272-274 Cross St Unit 4
- 272-274 Cross St Unit 3
- 40-42 Upham St Unit 1
- 859 Broadway Unit 15
- 21 Hillside Ave Unit 21
- 48 Cleveland Ave
- 139 Bucknam St
- 881 Broadway Unit 44
- 89 Judson St
- 51 Thurman St
- 80 Main St Unit 9
Your Personal Tour Guide
Ask me questions while you tour the home.