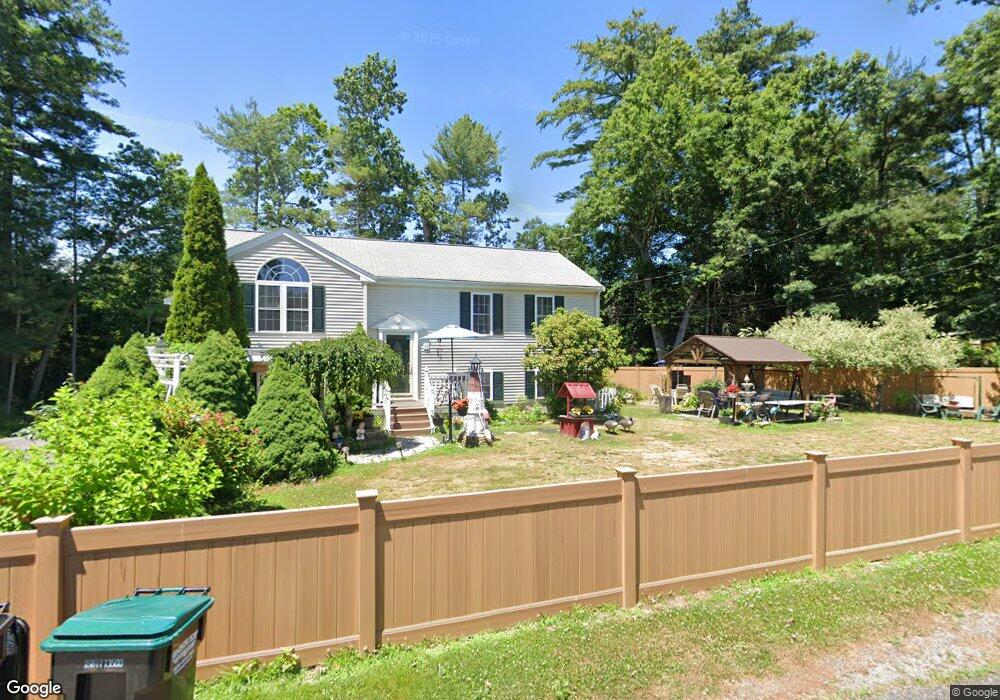
42 Charles St Monponsett, MA 02350
Estimated Value: $461,030 - $542,000
3
Beds
2
Baths
1,023
Sq Ft
$496/Sq Ft
Est. Value
About This Home
This home is located at 42 Charles St, Monponsett, MA 02350 and is currently estimated at $507,008, approximately $495 per square foot. 42 Charles St is a home located in Plymouth County.
Ownership History
Date
Name
Owned For
Owner Type
Purchase Details
Closed on
Apr 30, 2002
Sold by
Tsb Rt
Bought by
Keeley Joann G and Keeley Phillip R
Current Estimated Value
Home Financials for this Owner
Home Financials are based on the most recent Mortgage that was taken out on this home.
Original Mortgage
$220,000
Interest Rate
7.05%
Mortgage Type
Purchase Money Mortgage
Purchase Details
Closed on
Oct 18, 2001
Sold by
Badger Lincoln M and Badger Evelyn M
Bought by
Elk Constr Corp
Create a Home Valuation Report for This Property
The Home Valuation Report is an in-depth analysis detailing your home's value as well as a comparison with similar homes in the area
Home Values in the Area
Average Home Value in this Area
Purchase History
| Date | Buyer | Sale Price | Title Company |
|---|---|---|---|
| Keeley Joann G | $234,900 | -- | |
| Elk Constr Corp | $18,000 | -- |
Source: Public Records
Mortgage History
| Date | Status | Borrower | Loan Amount |
|---|---|---|---|
| Open | Elk Constr Corp | $231,000 | |
| Closed | Elk Constr Corp | $220,000 |
Source: Public Records
Tax History Compared to Growth
Tax History
| Year | Tax Paid | Tax Assessment Tax Assessment Total Assessment is a certain percentage of the fair market value that is determined by local assessors to be the total taxable value of land and additions on the property. | Land | Improvement |
|---|---|---|---|---|
| 2025 | $5,443 | $406,800 | $143,600 | $263,200 |
| 2024 | $5,331 | $398,400 | $139,500 | $258,900 |
| 2023 | $5,213 | $367,600 | $139,500 | $228,100 |
| 2022 | $5,084 | $336,900 | $126,800 | $210,100 |
| 2021 | $4,637 | $307,100 | $121,900 | $185,200 |
| 2020 | $4,566 | $299,000 | $117,800 | $181,200 |
| 2019 | $4,275 | $275,300 | $108,300 | $167,000 |
| 2018 | $4,222 | $266,700 | $104,100 | $162,600 |
| 2017 | $3,984 | $249,300 | $92,500 | $156,800 |
| 2016 | $3,979 | $240,400 | $92,500 | $147,900 |
| 2015 | $3,765 | $236,500 | $92,500 | $144,000 |
Source: Public Records
Map
Nearby Homes