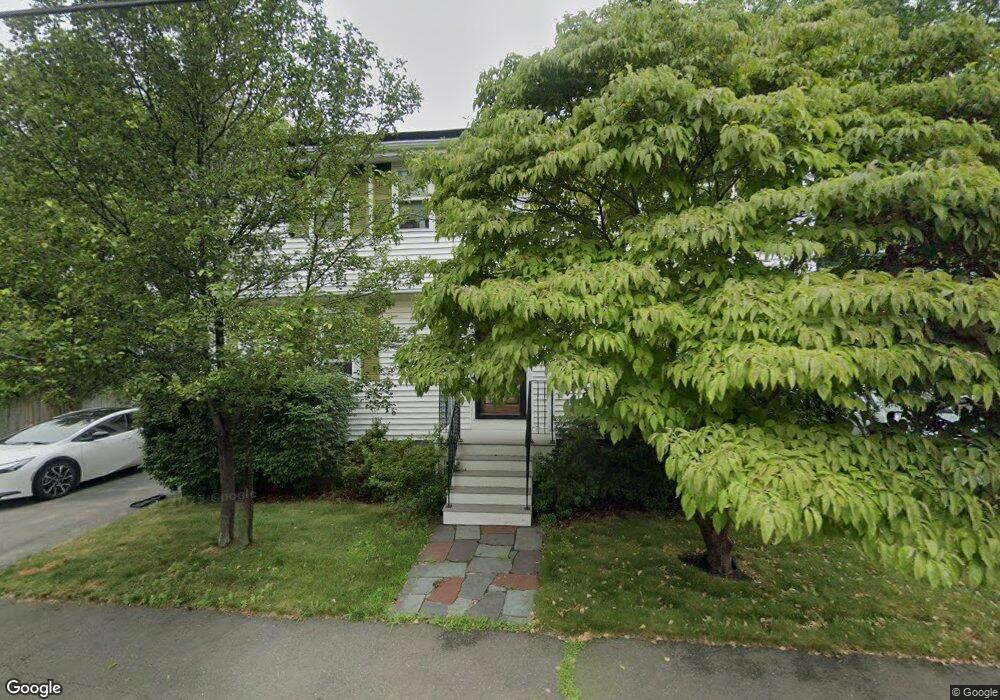
42 Charles St Salem, MA 01970
South Salem NeighborhoodEstimated Value: $665,112 - $776,000
4
Beds
2
Baths
1,800
Sq Ft
$398/Sq Ft
Est. Value
About This Home
This home is located at 42 Charles St, Salem, MA 01970 and is currently estimated at $715,778, approximately $397 per square foot. 42 Charles St is a home located in Essex County with nearby schools including Saltonstall School, Horace Mann Laboratory, and Carlton Elementary School.
Ownership History
Date
Name
Owned For
Owner Type
Purchase Details
Closed on
Feb 12, 2018
Sold by
Lobsitz Debra C and Lobsitz Richard M
Bought by
Lobsitz Debra C
Current Estimated Value
Purchase Details
Closed on
Oct 1, 2010
Sold by
Schoelles Craig M and Risley Dee A
Bought by
Lobsitz Richard M and Lobsitz Debra C
Home Financials for this Owner
Home Financials are based on the most recent Mortgage that was taken out on this home.
Original Mortgage
$189,750
Interest Rate
4.44%
Mortgage Type
Purchase Money Mortgage
Purchase Details
Closed on
Nov 23, 1998
Sold by
Dragon N Peter and Dragon Kendra B
Bought by
Schoelles Craig M and Risley Dee A
Purchase Details
Closed on
Feb 16, 1995
Sold by
Gray Dolores
Bought by
Dragon H Peter D and Dragon Kendra
Create a Home Valuation Report for This Property
The Home Valuation Report is an in-depth analysis detailing your home's value as well as a comparison with similar homes in the area
Home Values in the Area
Average Home Value in this Area
Purchase History
| Date | Buyer | Sale Price | Title Company |
|---|---|---|---|
| Lobsitz Debra C | -- | -- | |
| Lobsitz Richard M | $253,000 | -- | |
| Schoelles Craig M | $168,000 | -- | |
| Dragon H Peter D | $144,000 | -- |
Source: Public Records
Mortgage History
| Date | Status | Borrower | Loan Amount |
|---|---|---|---|
| Previous Owner | Dragon H Peter D | $189,750 | |
| Previous Owner | Dragon H Peter D | $172,000 |
Source: Public Records
Tax History Compared to Growth
Tax History
| Year | Tax Paid | Tax Assessment Tax Assessment Total Assessment is a certain percentage of the fair market value that is determined by local assessors to be the total taxable value of land and additions on the property. | Land | Improvement |
|---|---|---|---|---|
| 2025 | $6,094 | $537,400 | $205,800 | $331,600 |
| 2024 | $5,942 | $511,400 | $195,500 | $315,900 |
| 2023 | $5,681 | $454,100 | $180,500 | $273,600 |
| 2022 | $5,568 | $420,200 | $174,500 | $245,700 |
| 2021 | $5,574 | $403,900 | $162,400 | $241,500 |
| 2020 | $5,474 | $378,800 | $153,400 | $225,400 |
| 2019 | $5,350 | $354,300 | $145,600 | $208,700 |
| 2018 | $5,186 | $337,200 | $138,400 | $198,800 |
| 2017 | $4,893 | $308,500 | $116,700 | $191,800 |
| 2016 | $4,750 | $303,100 | $111,300 | $191,800 |
| 2015 | $4,654 | $283,600 | $102,300 | $181,300 |
Source: Public Records
Map
Nearby Homes
- 24 Wisteria St Unit 2
- 327 Lafayette St Unit 2
- 14 Meadow St
- 17 Cliff St
- 11 Sumner Rd
- 263 Jefferson Ave
- 436 Lafayette St
- 4 Willow Ave Unit 2
- 10 Hazel St Unit 2
- 10 Quadrant Rd
- 23 Marion Rd Unit B
- 1 Laurent Rd Unit 3
- 10 Horton St
- 2A Hazel St Unit 3
- 29 Willson St
- 2 Fletcher Way Unit 34D
- 9 Glover St Unit 1
- 9 Lyme St
- 7 Fairfield St
- 16 Leavitt St Unit 2
- 38 Charles St
- 46 Charles St
- 34 Charles St
- 43 Charles St Unit G4
- 43 Charles St Unit G3
- 43 Charles St Unit G2
- 43 Charles St Unit G1
- 43 Charles St
- 43 Charles St
- 37 Charles St
- 34 Loring Ave Unit B
- 34 Loring Ave Unit A
- 33 Charles St
- 50 Charles St
- 28 Loring Ave
- 1 Pacific St
- 26 Charles St
- 26 Loring Ave
- 51 Charles St
- 30 Loring Ave Unit B