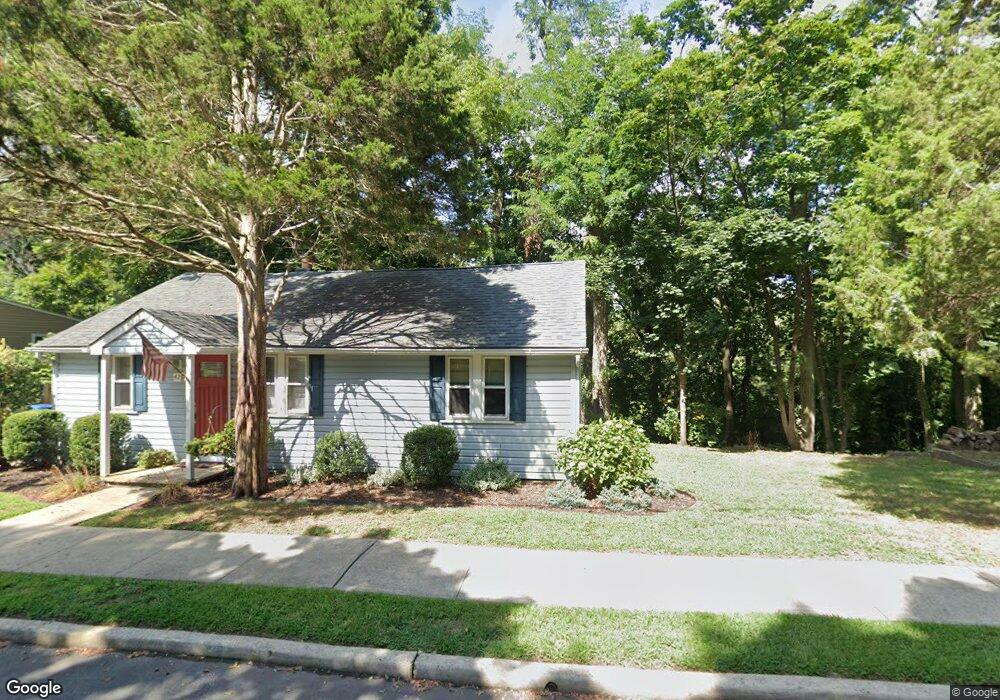
42 Chestnut St Lumberton, NJ 08048
Estimated Value: $288,000 - $395,000
3
Beds
2
Baths
864
Sq Ft
$373/Sq Ft
Est. Value
About This Home
This home is located at 42 Chestnut St, Lumberton, NJ 08048 and is currently estimated at $322,244, approximately $372 per square foot. 42 Chestnut St is a home located in Burlington County with nearby schools including Ashbrook Elementary School, Bobby’s Run School, and Lumberton Middle School.
Ownership History
Date
Name
Owned For
Owner Type
Purchase Details
Closed on
Oct 10, 2013
Sold by
Monico Melissa and Wasson James W
Bought by
Wasson Melissa and Wasson James W
Current Estimated Value
Home Financials for this Owner
Home Financials are based on the most recent Mortgage that was taken out on this home.
Original Mortgage
$115,500
Outstanding Balance
$86,991
Interest Rate
4.56%
Mortgage Type
New Conventional
Estimated Equity
$235,253
Purchase Details
Closed on
Jul 16, 2004
Sold by
Monico Melissa
Bought by
Monico Melissa and Wasson James W
Home Financials for this Owner
Home Financials are based on the most recent Mortgage that was taken out on this home.
Original Mortgage
$128,250
Interest Rate
6.2%
Mortgage Type
Purchase Money Mortgage
Purchase Details
Closed on
Apr 28, 1995
Sold by
Wheeland Lynne Hall and Hall Lynn
Bought by
Demarco Anthony
Create a Home Valuation Report for This Property
The Home Valuation Report is an in-depth analysis detailing your home's value as well as a comparison with similar homes in the area
Home Values in the Area
Average Home Value in this Area
Purchase History
| Date | Buyer | Sale Price | Title Company |
|---|---|---|---|
| Wasson Melissa | -- | Southern United Title Agency | |
| Monico Melissa | -- | Congress Title Corp | |
| Monico Melissa | $135,000 | Congress Title Corp | |
| Demarco Anthony | $91,500 | Congress Title Corp |
Source: Public Records
Mortgage History
| Date | Status | Borrower | Loan Amount |
|---|---|---|---|
| Open | Wasson Melissa | $115,500 | |
| Closed | Monico Melissa | $128,250 |
Source: Public Records
Tax History Compared to Growth
Tax History
| Year | Tax Paid | Tax Assessment Tax Assessment Total Assessment is a certain percentage of the fair market value that is determined by local assessors to be the total taxable value of land and additions on the property. | Land | Improvement |
|---|---|---|---|---|
| 2025 | $4,382 | $164,600 | $80,500 | $84,100 |
| 2024 | $4,120 | $164,600 | $80,500 | $84,100 |
| 2023 | $4,120 | $164,600 | $80,500 | $84,100 |
| 2022 | $4,024 | $164,600 | $80,500 | $84,100 |
| 2021 | $3,778 | $164,600 | $80,500 | $84,100 |
| 2020 | $3,978 | $164,600 | $80,500 | $84,100 |
| 2019 | $3,934 | $164,600 | $80,500 | $84,100 |
| 2018 | $3,875 | $164,600 | $80,500 | $84,100 |
| 2017 | $3,802 | $164,600 | $80,500 | $84,100 |
| 2016 | $3,720 | $164,600 | $80,500 | $84,100 |
| 2015 | $3,692 | $164,600 | $80,500 | $84,100 |
| 2014 | $3,552 | $164,600 | $80,500 | $84,100 |
Source: Public Records
Map
Nearby Homes
- 26 Chestnut St
- 587 Main St
- 15 Wellington Dr
- 10 Whitehaven Dr
- 485 Main St
- 5 Middleton Dr
- 23 Creek Rd
- 71 Kingsbridge Dr
- 20 Jasmine Rd
- 18 Azalea Dr
- 18 Westminster Dr
- 44 Rockland Terrace
- 5 Beulah Ave
- 25 Sunflower Cir
- 1476 Route 38 Unit 3
- 1476 Route 38 Unit 8
- 8 Hollybrook Ave
- 12 Bancroft Ln
- 511 Hamilton Ave
- 11 Abington Way