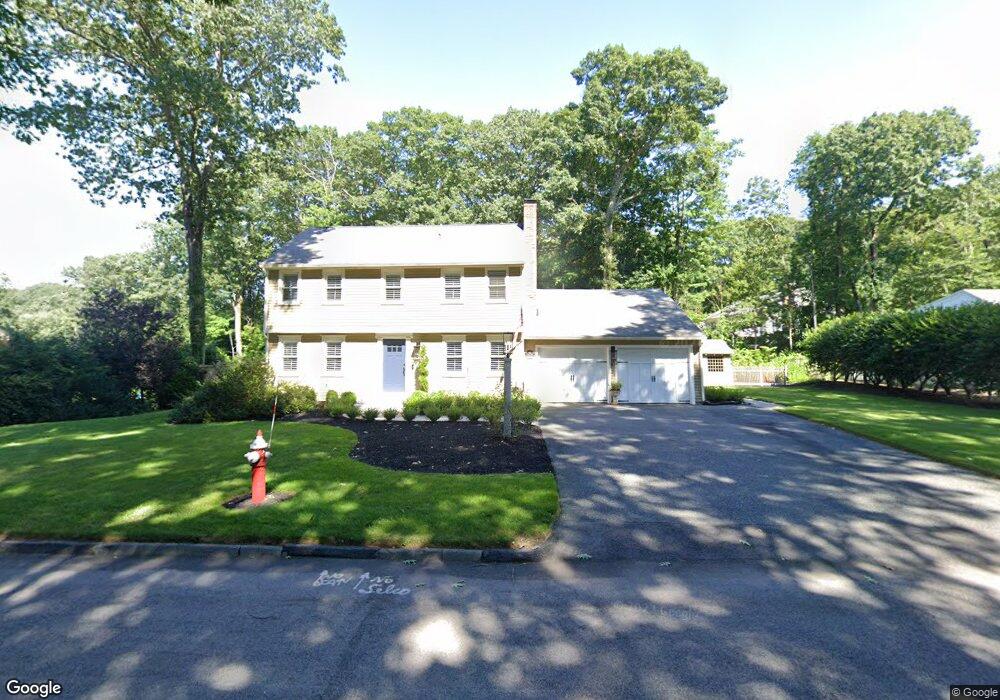
42 Colton Ln Shrewsbury, MA 01545
Estimated Value: $745,000 - $874,000
4
Beds
3
Baths
1,954
Sq Ft
$415/Sq Ft
Est. Value
About This Home
This home is located at 42 Colton Ln, Shrewsbury, MA 01545 and is currently estimated at $810,005, approximately $414 per square foot. 42 Colton Ln is a home located in Worcester County with nearby schools including Walter J. Paton Elementary School, Sherwood Middle School, and Oak Middle School.
Ownership History
Date
Name
Owned For
Owner Type
Purchase Details
Closed on
Oct 8, 2019
Sold by
Buonomo James R and Buonomo Paula J
Bought by
Hathaway Michael J and Hathaway Frances M
Current Estimated Value
Home Financials for this Owner
Home Financials are based on the most recent Mortgage that was taken out on this home.
Original Mortgage
$385,000
Outstanding Balance
$338,647
Interest Rate
3.7%
Mortgage Type
New Conventional
Estimated Equity
$471,358
Purchase Details
Closed on
Nov 24, 1982
Bought by
Buonomo James R and Buonomo Paula J
Create a Home Valuation Report for This Property
The Home Valuation Report is an in-depth analysis detailing your home's value as well as a comparison with similar homes in the area
Home Values in the Area
Average Home Value in this Area
Purchase History
| Date | Buyer | Sale Price | Title Company |
|---|---|---|---|
| Hathaway Michael J | $525,000 | -- | |
| Buonomo James R | $90,000 | -- |
Source: Public Records
Mortgage History
| Date | Status | Borrower | Loan Amount |
|---|---|---|---|
| Open | Hathaway Michael J | $385,000 | |
| Closed | Hathaway Michael J | $385,000 | |
| Previous Owner | Buonomo James R | $265,000 | |
| Previous Owner | Buonomo James R | $125,000 |
Source: Public Records
Tax History Compared to Growth
Tax History
| Year | Tax Paid | Tax Assessment Tax Assessment Total Assessment is a certain percentage of the fair market value that is determined by local assessors to be the total taxable value of land and additions on the property. | Land | Improvement |
|---|---|---|---|---|
| 2025 | $89 | $739,300 | $293,000 | $446,300 |
| 2024 | $8,734 | $705,500 | $279,000 | $426,500 |
| 2023 | $8,272 | $630,500 | $279,000 | $351,500 |
| 2022 | $7,007 | $496,600 | $219,200 | $277,400 |
| 2021 | $6,294 | $477,200 | $219,200 | $258,000 |
| 2020 | $5,992 | $480,500 | $219,200 | $261,300 |
| 2019 | $5,719 | $455,000 | $205,000 | $250,000 |
| 2018 | $5,591 | $441,600 | $193,400 | $248,200 |
| 2017 | $5,327 | $415,200 | $175,000 | $240,200 |
| 2016 | $5,281 | $406,200 | $164,000 | $242,200 |
| 2015 | $5,181 | $392,500 | $150,300 | $242,200 |
Source: Public Records
Map
Nearby Homes