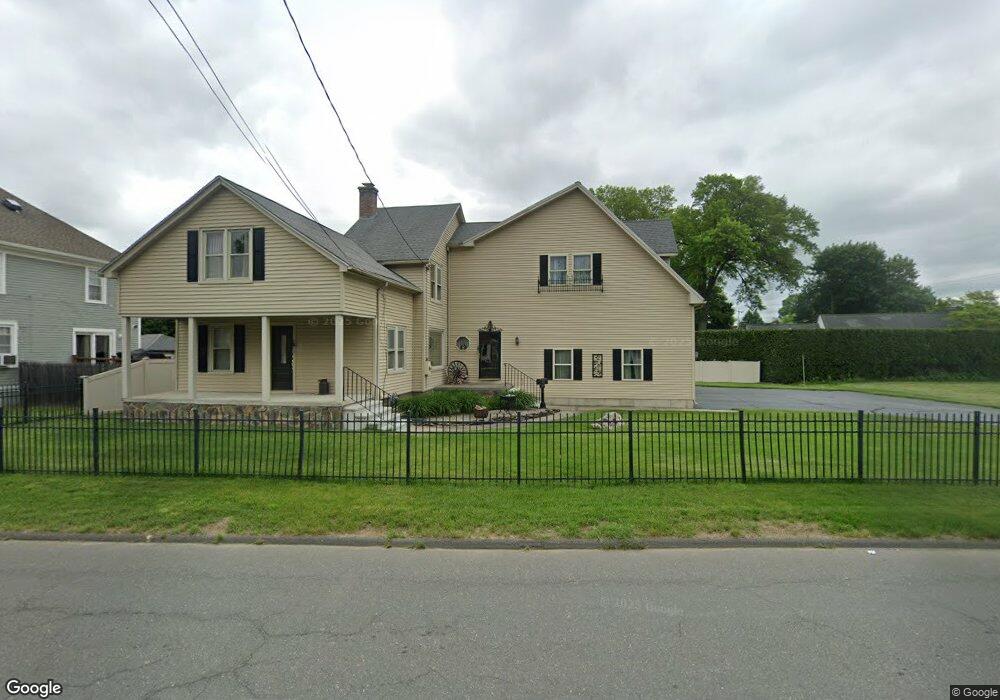
42 Cross St Westfield, MA 01085
Estimated Value: $314,000 - $365,000
3
Beds
1
Bath
1,554
Sq Ft
$217/Sq Ft
Est. Value
About This Home
This home is located at 42 Cross St, Westfield, MA 01085 and is currently estimated at $337,250, approximately $217 per square foot. 42 Cross St is a home located in Hampden County with nearby schools including Westfield High School and Saint Mary High School.
Ownership History
Date
Name
Owned For
Owner Type
Purchase Details
Closed on
May 15, 2003
Sold by
Lampson Donna J and Lampson Jonathan M
Bought by
Poirier Constance M
Current Estimated Value
Purchase Details
Closed on
Aug 17, 2001
Sold by
Bertrand James V and Bertrand Kathleen P
Bought by
Lampson Jonathan M and Lampson Donna J
Home Financials for this Owner
Home Financials are based on the most recent Mortgage that was taken out on this home.
Original Mortgage
$95,900
Interest Rate
7.16%
Mortgage Type
Purchase Money Mortgage
Create a Home Valuation Report for This Property
The Home Valuation Report is an in-depth analysis detailing your home's value as well as a comparison with similar homes in the area
Home Values in the Area
Average Home Value in this Area
Purchase History
| Date | Buyer | Sale Price | Title Company |
|---|---|---|---|
| Poirier Constance M | $161,000 | -- | |
| Lampson Jonathan M | $119,900 | -- |
Source: Public Records
Mortgage History
| Date | Status | Borrower | Loan Amount |
|---|---|---|---|
| Previous Owner | Lampson Jonathan M | $95,900 | |
| Previous Owner | Lampson Jonathan M | $17,985 |
Source: Public Records
Tax History Compared to Growth
Tax History
| Year | Tax Paid | Tax Assessment Tax Assessment Total Assessment is a certain percentage of the fair market value that is determined by local assessors to be the total taxable value of land and additions on the property. | Land | Improvement |
|---|---|---|---|---|
| 2025 | $4,724 | $311,200 | $99,000 | $212,200 |
| 2024 | $4,550 | $284,900 | $90,200 | $194,700 |
| 2023 | $4,169 | $256,300 | $85,600 | $170,700 |
| 2022 | $4,169 | $225,500 | $76,700 | $148,800 |
| 2021 | $3,103 | $212,200 | $72,100 | $140,100 |
| 2020 | $3,875 | $201,300 | $72,100 | $129,200 |
| 2019 | $2,859 | $191,400 | $68,800 | $122,600 |
| 2018 | $3,706 | $191,400 | $68,800 | $122,600 |
| 2017 | $3,651 | $188,000 | $69,800 | $118,200 |
| 2016 | $3,655 | $188,000 | $69,800 | $118,200 |
| 2015 | $3,486 | $188,000 | $69,800 | $118,200 |
| 2014 | $2,480 | $188,000 | $69,800 | $118,200 |
Source: Public Records
Map
Nearby Homes
- 138 Main St Unit 13
- 138 Main St Unit 11
- 33 George St
- 16 Yale St
- 8 Cherry St
- 23 Hancock St
- 13 William St
- 51 Washington St
- 97 Mechanic St
- 15 Bates St
- 5 Sibley Ave
- 13 King Place
- 74 S Maple St
- 82 S Maple St Unit 11
- 77 Orange St
- 119 Union St Unit 4
- 111 Union St Unit 6
- 8 Ellis St
- Lot 3 Montgomery
- 0 Little River Road ( Rear )
- 40 Cross St
- 131 Lindbergh Blvd
- 38 E Silver St
- 133 Lindbergh Blvd
- 125 Lindbergh Blvd
- 38 Cross St
- 38 Cross St Unit 2
- 38 Cross St Unit 1
- 45 Cross St
- 43 Cross St
- 119 Lindbergh Blvd
- 37 Cross St
- 41 Cross St
- 34 E Silver St
- 138 Lindbergh Blvd
- 130 Lindbergh Blvd
- 113 Lindbergh Blvd
- 21 Ashley St
- 36 Cross St
- 36 1/2 Cross St