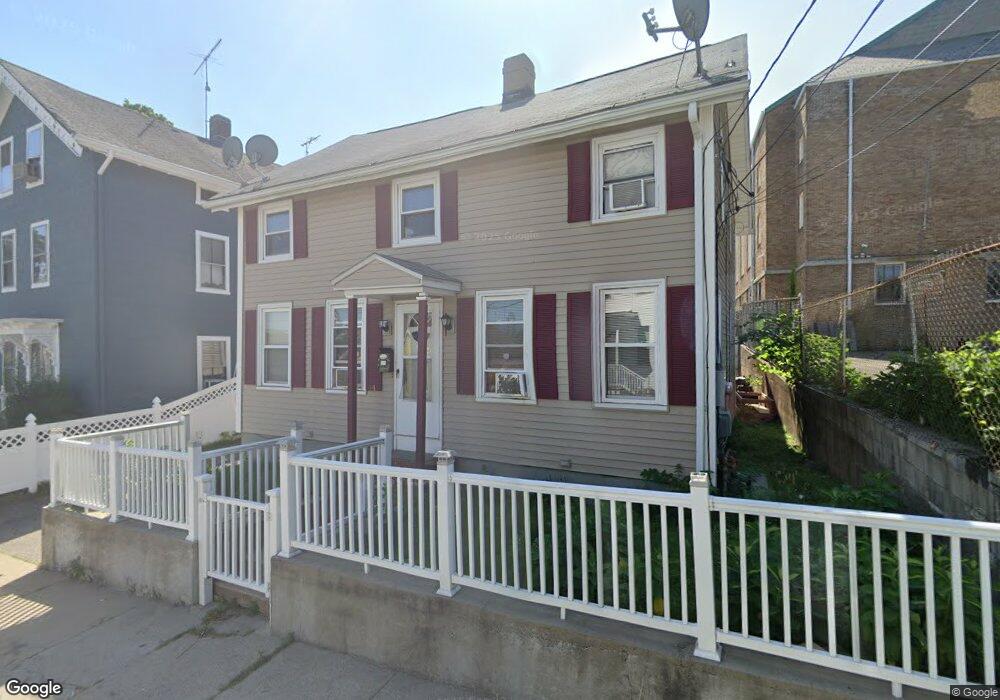
42 Darrow St Pawtucket, RI 02860
Downtown Pawtucket NeighborhoodEstimated Value: $380,000 - $450,000
4
Beds
2
Baths
2,100
Sq Ft
$198/Sq Ft
Est. Value
About This Home
This home is located at 42 Darrow St, Pawtucket, RI 02860 and is currently estimated at $416,681, approximately $198 per square foot. 42 Darrow St is a home located in Providence County with nearby schools including International Charter School, Blackstone Academy Charter School, and Saint Raphael Academy.
Ownership History
Date
Name
Owned For
Owner Type
Purchase Details
Closed on
Oct 28, 2011
Sold by
Bald Eagle Group
Bought by
Romero Ana L
Current Estimated Value
Home Financials for this Owner
Home Financials are based on the most recent Mortgage that was taken out on this home.
Original Mortgage
$111,928
Outstanding Balance
$75,815
Interest Rate
4.11%
Estimated Equity
$340,866
Purchase Details
Closed on
Nov 30, 2010
Sold by
Fnma
Bought by
Bald Eagle Grp
Purchase Details
Closed on
Sep 17, 2010
Sold by
Freeman Clydies
Bought by
Federal National Mortgage Association
Create a Home Valuation Report for This Property
The Home Valuation Report is an in-depth analysis detailing your home's value as well as a comparison with similar homes in the area
Home Values in the Area
Average Home Value in this Area
Purchase History
| Date | Buyer | Sale Price | Title Company |
|---|---|---|---|
| Romero Ana L | $115,000 | -- | |
| Bald Eagle Grp | $63,115 | -- | |
| Federal National Mortgage Association | $198,699 | -- |
Source: Public Records
Mortgage History
| Date | Status | Borrower | Loan Amount |
|---|---|---|---|
| Open | Federal National Mortgage Association | $111,928 | |
| Previous Owner | Federal National Mortgage Association | $32,550 |
Source: Public Records
Tax History
| Year | Tax Paid | Tax Assessment Tax Assessment Total Assessment is a certain percentage of the fair market value that is determined by local assessors to be the total taxable value of land and additions on the property. | Land | Improvement |
|---|---|---|---|---|
| 2025 | $4,137 | $314,600 | $80,100 | $234,500 |
| 2024 | $3,882 | $314,600 | $80,100 | $234,500 |
| 2023 | $3,398 | $200,600 | $35,000 | $165,600 |
| 2022 | $3,326 | $200,600 | $35,000 | $165,600 |
| 2021 | $3,326 | $200,600 | $35,000 | $165,600 |
| 2020 | $3,200 | $153,200 | $43,700 | $109,500 |
| 2019 | $3,200 | $153,200 | $43,700 | $109,500 |
| 2018 | $3,084 | $153,200 | $43,700 | $109,500 |
| 2017 | $2,726 | $120,000 | $38,300 | $81,700 |
| 2016 | $2,627 | $120,000 | $38,300 | $81,700 |
| 2015 | $2,627 | $120,000 | $38,300 | $81,700 |
| 2014 | $2,603 | $112,900 | $38,300 | $74,600 |
Source: Public Records
Map
Nearby Homes
- 396 Roosevelt Ave
- 256 High St
- 300 Front St Unit 105
- 300 Front St Unit 409
- 88 Barton St
- 511 High St
- 517 High St
- 78 Barton St
- 84 Barton St
- 35 Laurel St
- 234 Central St Unit 236
- 153 Central Ave
- 48 Kossuth St
- 133 Cottage St
- 140 Dexter St
- 23 Spring St
- 36 Underwood St
- 7 Fales St
- 30 Foundry St Unit 6
- 28 Bayley St Unit 107
Your Personal Tour Guide
Ask me questions while you tour the home.