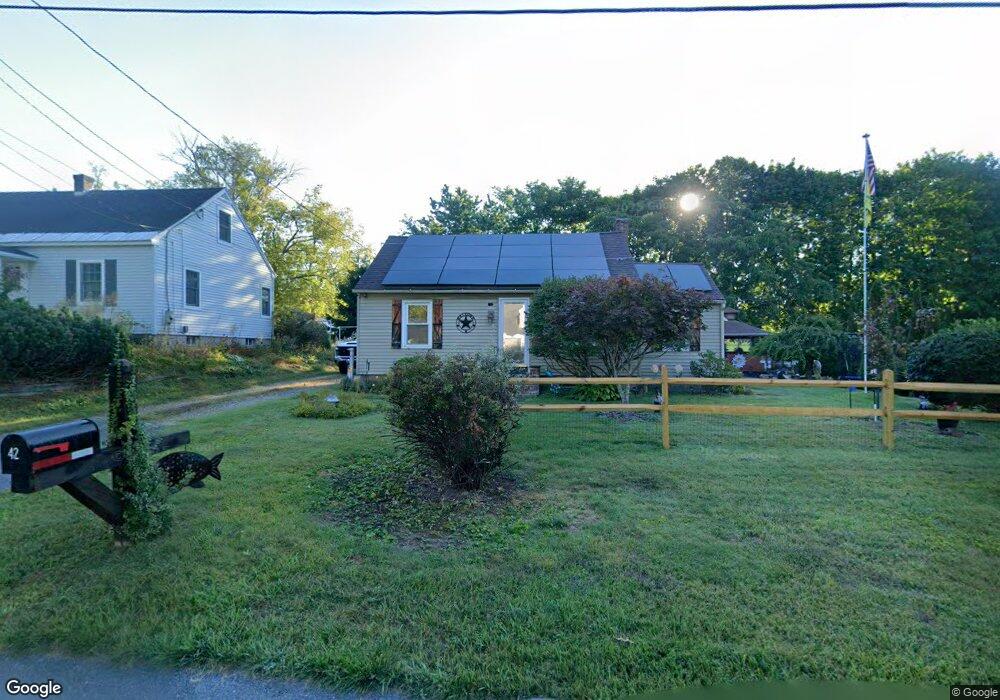
42 David St Dalton, MA 01226
Estimated Value: $235,000 - $289,636
2
Beds
1
Bath
985
Sq Ft
$270/Sq Ft
Est. Value
About This Home
This home is located at 42 David St, Dalton, MA 01226 and is currently estimated at $265,909, approximately $269 per square foot. 42 David St is a home located in Berkshire County with nearby schools including Wahconah Regional High School and St. Agnes Academy.
Ownership History
Date
Name
Owned For
Owner Type
Purchase Details
Closed on
May 21, 1999
Sold by
Wmfc 1997-4 Prop
Bought by
Liebenow Austin A and Liebenow Tammy L
Current Estimated Value
Purchase Details
Closed on
Dec 8, 1998
Sold by
Pierce Thomas R
Bought by
Wmfc 1997-4 Properties
Purchase Details
Closed on
Sep 21, 1998
Sold by
Pierce Thoams R
Bought by
Wmfc 1997-4 Properties
Purchase Details
Closed on
Nov 29, 1988
Sold by
Sherman Homer H
Bought by
Pierce Thomas R
Create a Home Valuation Report for This Property
The Home Valuation Report is an in-depth analysis detailing your home's value as well as a comparison with similar homes in the area
Home Values in the Area
Average Home Value in this Area
Purchase History
| Date | Buyer | Sale Price | Title Company |
|---|---|---|---|
| Liebenow Austin A | $52,250 | -- | |
| Liebenow Austin A | $52,250 | -- | |
| Wmfc 1997-4 Properties | $52,500 | -- | |
| Wmfc 1997-4 Properties | $52,500 | -- | |
| Wmfc 1997-4 Properties | $52,500 | -- | |
| Wmfc 1997-4 Properties | $52,500 | -- | |
| Pierce Thomas R | $69,100 | -- |
Source: Public Records
Mortgage History
| Date | Status | Borrower | Loan Amount |
|---|---|---|---|
| Open | Pierce Thomas R | $146,252 | |
| Closed | Pierce Thomas R | $11,276 |
Source: Public Records
Tax History
| Year | Tax Paid | Tax Assessment Tax Assessment Total Assessment is a certain percentage of the fair market value that is determined by local assessors to be the total taxable value of land and additions on the property. | Land | Improvement |
|---|---|---|---|---|
| 2025 | $4,676 | $257,900 | $67,700 | $190,200 |
| 2024 | $4,317 | $237,200 | $62,200 | $175,000 |
| 2023 | $3,671 | $204,000 | $57,900 | $146,100 |
| 2022 | $3,671 | $177,000 | $57,900 | $119,100 |
| 2021 | $3,685 | $171,300 | $54,600 | $116,700 |
| 2020 | $3,344 | $164,800 | $54,600 | $110,200 |
| 2019 | $3,123 | $160,300 | $57,800 | $102,500 |
| 2018 | $3,114 | $156,400 | $57,800 | $98,600 |
| 2017 | $3,108 | $156,400 | $57,800 | $98,600 |
| 2016 | $3,276 | $166,900 | $57,800 | $109,100 |
| 2015 | $3,113 | $159,900 | $52,900 | $107,000 |
Source: Public Records
Map
Nearby Homes
- 319 North St
- 60 Franklin St
- 188 North St
- 20 Prospect St
- 70 Lake St Unit B
- 0 Crane Ave Suite 2 -- Unit 248430
- 0 Crane Ave Suite 1 -- Unit 248429
- 32 Marcella Way
- 60 North St Unit 7
- 1030 Main St
- 1157 Main St
- 165 High St
- 750 Main St
- 18 Chestnut St
- 65 Johnson Rd
- 218 Johnson Rd
- 190 Fox Rd
- 0 Crane Ave
- 127 Pinecrest Dr
- 149 Kittredge Rd
Your Personal Tour Guide
Ask me questions while you tour the home.