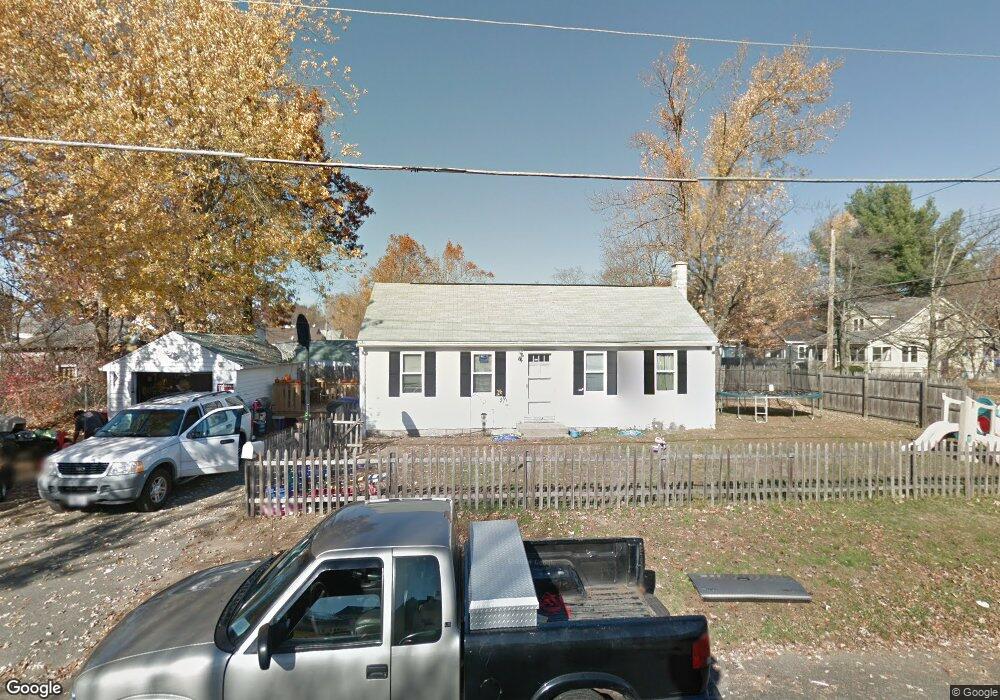
42 Devonshire Rd Springfield, MA 01109
Pine Point NeighborhoodEstimated Value: $213,000 - $255,000
2
Beds
1
Bath
766
Sq Ft
$313/Sq Ft
Est. Value
About This Home
This home is located at 42 Devonshire Rd, Springfield, MA 01109 and is currently estimated at $239,964, approximately $313 per square foot. 42 Devonshire Rd is a home located in Hampden County with nearby schools including Thomas M Balliet Elementary School, John J Duggan Middle, and Roger L. Putnam Vocational Technical Academy.
Ownership History
Date
Name
Owned For
Owner Type
Purchase Details
Closed on
Dec 31, 2004
Sold by
Kenyon Mark A
Bought by
Green Shelly A
Current Estimated Value
Home Financials for this Owner
Home Financials are based on the most recent Mortgage that was taken out on this home.
Original Mortgage
$87,000
Outstanding Balance
$43,867
Interest Rate
5.73%
Mortgage Type
Purchase Money Mortgage
Estimated Equity
$196,097
Purchase Details
Closed on
Mar 10, 1995
Sold by
Kenyon Arthur R and Kenyon Eileen B
Bought by
Kenyon Mark A
Home Financials for this Owner
Home Financials are based on the most recent Mortgage that was taken out on this home.
Original Mortgage
$30,000
Interest Rate
9.09%
Mortgage Type
Purchase Money Mortgage
Create a Home Valuation Report for This Property
The Home Valuation Report is an in-depth analysis detailing your home's value as well as a comparison with similar homes in the area
Home Values in the Area
Average Home Value in this Area
Purchase History
| Date | Buyer | Sale Price | Title Company |
|---|---|---|---|
| Green Shelly A | $87,000 | -- | |
| Kenyon Mark A | $30,000 | -- |
Source: Public Records
Mortgage History
| Date | Status | Borrower | Loan Amount |
|---|---|---|---|
| Open | Green Shelly A | $87,000 | |
| Previous Owner | Kenyon Mark A | $30,000 |
Source: Public Records
Tax History
| Year | Tax Paid | Tax Assessment Tax Assessment Total Assessment is a certain percentage of the fair market value that is determined by local assessors to be the total taxable value of land and additions on the property. | Land | Improvement |
|---|---|---|---|---|
| 2025 | $3,098 | $197,600 | $39,000 | $158,600 |
| 2024 | $2,928 | $182,300 | $32,500 | $149,800 |
| 2023 | $2,547 | $149,400 | $29,500 | $119,900 |
| 2022 | $2,701 | $143,500 | $27,600 | $115,900 |
| 2021 | $2,255 | $119,300 | $25,100 | $94,200 |
| 2020 | $2,090 | $107,000 | $25,100 | $81,900 |
| 2019 | $2,015 | $102,400 | $25,100 | $77,300 |
| 2018 | $1,990 | $101,100 | $25,100 | $76,000 |
| 2017 | $1,972 | $100,300 | $23,200 | $77,100 |
| 2016 | $1,972 | $100,300 | $23,200 | $77,100 |
| 2015 | $1,818 | $92,400 | $23,200 | $69,200 |
Source: Public Records
Map
Nearby Homes
Your Personal Tour Guide
Ask me questions while you tour the home.