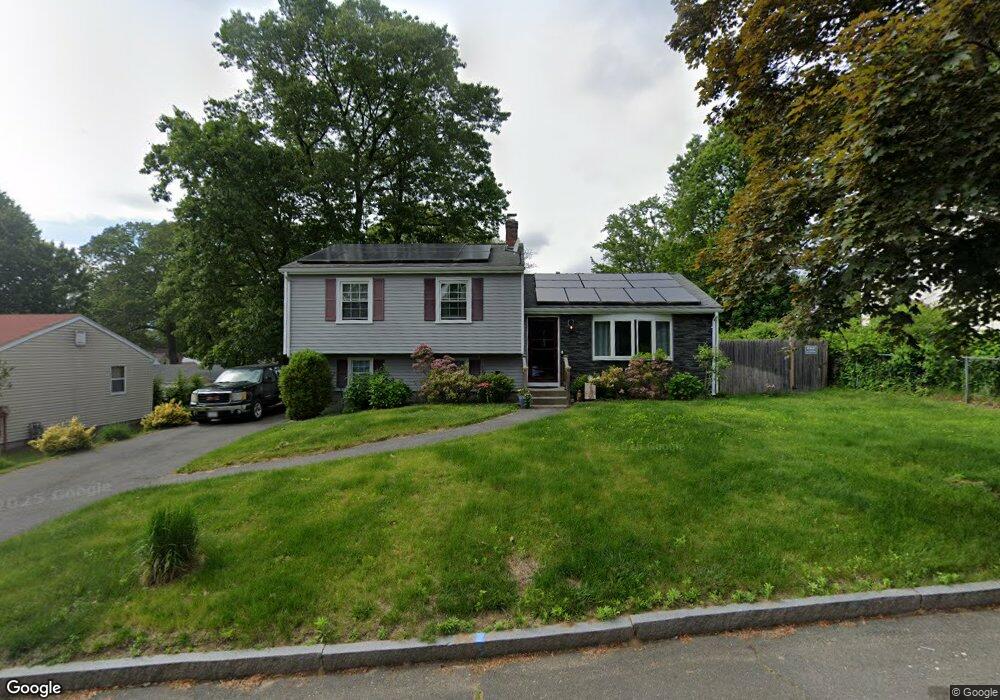
42 Drumlin Rd Springfield, MA 01108
Forest Park NeighborhoodEstimated Value: $318,000 - $368,000
3
Beds
2
Baths
1,680
Sq Ft
$203/Sq Ft
Est. Value
About This Home
This home is located at 42 Drumlin Rd, Springfield, MA 01108 and is currently estimated at $340,823, approximately $202 per square foot. 42 Drumlin Rd is a home located in Hampden County with nearby schools including Alice B. Beal Elementary School, Forest Park Middle School, and High School Of Commerce.
Ownership History
Date
Name
Owned For
Owner Type
Purchase Details
Closed on
Dec 9, 2019
Sold by
Moultrie Suzanne T
Bought by
Moultrie Suzanne T and Moultrie Gregory
Current Estimated Value
Home Financials for this Owner
Home Financials are based on the most recent Mortgage that was taken out on this home.
Original Mortgage
$140,000
Outstanding Balance
$123,796
Interest Rate
3.6%
Mortgage Type
New Conventional
Estimated Equity
$217,027
Purchase Details
Closed on
Jan 19, 2017
Sold by
Hicks Leo S and Hicks Suzanne T
Bought by
Hicks Suzanne T
Purchase Details
Closed on
Jan 31, 1991
Sold by
Ryan Linda M and Molloy John J
Bought by
Hicks Leo S and Hicks Suzanne T
Home Financials for this Owner
Home Financials are based on the most recent Mortgage that was taken out on this home.
Original Mortgage
$102,813
Interest Rate
9.52%
Mortgage Type
Purchase Money Mortgage
Create a Home Valuation Report for This Property
The Home Valuation Report is an in-depth analysis detailing your home's value as well as a comparison with similar homes in the area
Home Values in the Area
Average Home Value in this Area
Purchase History
| Date | Buyer | Sale Price | Title Company |
|---|---|---|---|
| Moultrie Suzanne T | -- | None Available | |
| Hicks Suzanne T | -- | -- | |
| Hicks Leo S | $104,000 | -- |
Source: Public Records
Mortgage History
| Date | Status | Borrower | Loan Amount |
|---|---|---|---|
| Open | Moultrie Suzanne T | $140,000 | |
| Previous Owner | Hicks Leo S | $96,006 | |
| Previous Owner | Hicks Leo S | $21,685 | |
| Previous Owner | Hicks Leo S | $101,931 | |
| Previous Owner | Hicks Leo S | $102,813 |
Source: Public Records
Tax History
| Year | Tax Paid | Tax Assessment Tax Assessment Total Assessment is a certain percentage of the fair market value that is determined by local assessors to be the total taxable value of land and additions on the property. | Land | Improvement |
|---|---|---|---|---|
| 2025 | $4,268 | $272,200 | $47,400 | $224,800 |
| 2024 | $3,890 | $242,200 | $47,400 | $194,800 |
| 2023 | $3,840 | $225,200 | $40,100 | $185,100 |
| 2022 | $3,538 | $188,000 | $40,100 | $147,900 |
| 2021 | $3,364 | $178,000 | $36,500 | $141,500 |
| 2020 | $2,849 | $145,900 | $36,500 | $109,400 |
| 2019 | $2,824 | $143,500 | $36,500 | $107,000 |
| 2018 | $2,686 | $144,500 | $36,500 | $108,000 |
| 2017 | $2,686 | $136,600 | $36,500 | $100,100 |
| 2016 | $2,338 | $118,900 | $36,500 | $82,400 |
| 2015 | $2,321 | $118,000 | $36,500 | $81,500 |
Source: Public Records
Map
Nearby Homes
- 23 Fairway Dr
- 70 Hartwick St
- 0 Donald Ave
- 235 Vineland Ave
- 138 Vineland Ave
- 78 Wood Ave
- 52 Bremen St
- 40 Halifax Ct Unit D
- 137 Carroll St
- 132 Carroll St
- 14 Kronvall Ln
- 42 Carroll St
- 179 Carver St
- 12 Carroll St
- 26 Dwight Rd
- 147 Belvidere St
- 20 Jamestown Dr Unit B
- 38 Manchester Terrace
- 33-35 Ruskin St
- 104 Appleton St
Your Personal Tour Guide
Ask me questions while you tour the home.