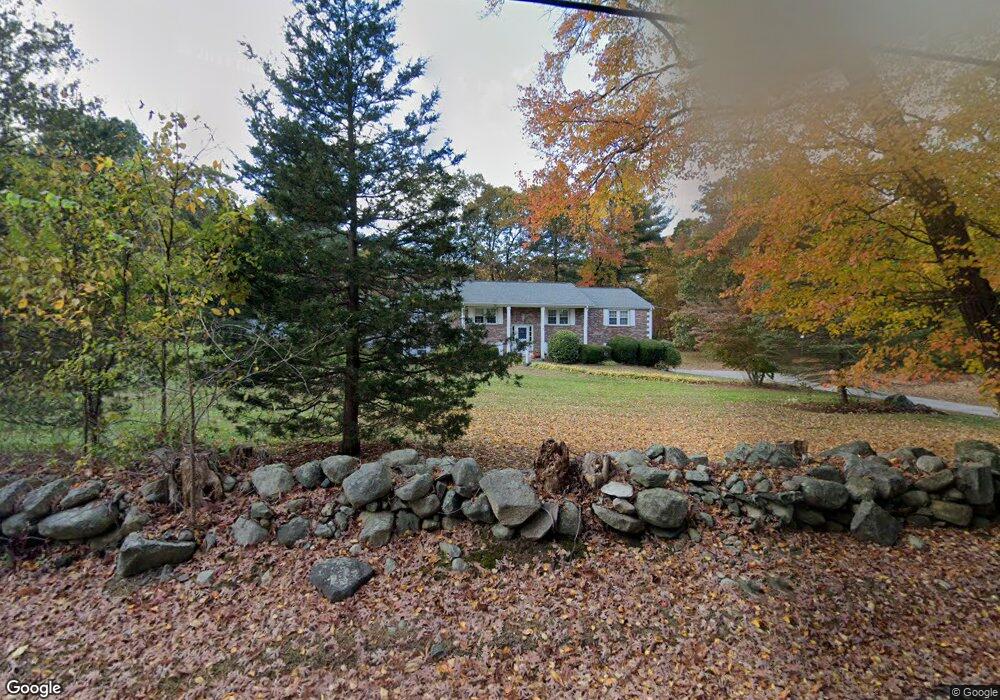
42 Ellis St Medway, MA 02053
Estimated Value: $755,231 - $826,000
4
Beds
3
Baths
1,702
Sq Ft
$471/Sq Ft
Est. Value
About This Home
This home is located at 42 Ellis St, Medway, MA 02053 and is currently estimated at $801,058, approximately $470 per square foot. 42 Ellis St is a home located in Norfolk County with nearby schools including John D. McGovern Elementary School, Burke-Memorial Elementary, and Medway Middle School.
Ownership History
Date
Name
Owned For
Owner Type
Purchase Details
Closed on
Sep 20, 2024
Sold by
Cassidy David L and Cassidy Carol L
Bought by
Cassidy Ft and Cassidy
Current Estimated Value
Purchase Details
Closed on
Jul 30, 1990
Sold by
Marsh Alphonso H
Bought by
Cassidy David L
Home Financials for this Owner
Home Financials are based on the most recent Mortgage that was taken out on this home.
Original Mortgage
$75,000
Interest Rate
10.01%
Mortgage Type
Purchase Money Mortgage
Create a Home Valuation Report for This Property
The Home Valuation Report is an in-depth analysis detailing your home's value as well as a comparison with similar homes in the area
Home Values in the Area
Average Home Value in this Area
Purchase History
| Date | Buyer | Sale Price | Title Company |
|---|---|---|---|
| Cassidy Ft | -- | None Available | |
| Cassidy Ft | -- | None Available | |
| Cassidy David L | $186,000 | -- | |
| Cassidy David L | $186,000 | -- |
Source: Public Records
Mortgage History
| Date | Status | Borrower | Loan Amount |
|---|---|---|---|
| Previous Owner | Cassidy David L | $5,000 | |
| Previous Owner | Cassidy David L | $80,000 | |
| Previous Owner | Cassidy David L | $75,000 |
Source: Public Records
Tax History Compared to Growth
Tax History
| Year | Tax Paid | Tax Assessment Tax Assessment Total Assessment is a certain percentage of the fair market value that is determined by local assessors to be the total taxable value of land and additions on the property. | Land | Improvement |
|---|---|---|---|---|
| 2025 | $9,250 | $649,100 | $340,200 | $308,900 |
| 2024 | $9,347 | $649,100 | $340,200 | $308,900 |
| 2023 | $9,615 | $603,200 | $309,700 | $293,500 |
| 2022 | $8,407 | $496,600 | $229,100 | $267,500 |
| 2021 | $8,166 | $467,700 | $213,800 | $253,900 |
| 2020 | $8,108 | $463,300 | $213,800 | $249,500 |
| 2019 | $7,580 | $446,700 | $205,100 | $241,600 |
| 2018 | $7,636 | $432,400 | $196,400 | $236,000 |
| 2017 | $7,215 | $402,600 | $192,100 | $210,500 |
| 2016 | $7,014 | $387,300 | $176,800 | $210,500 |
| 2015 | $7,059 | $387,000 | $174,600 | $212,400 |
| 2014 | $6,724 | $356,900 | $175,000 | $181,900 |
Source: Public Records
Map
Nearby Homes
- 106 Holliston St
- 1 Walnut Ln
- 50 Main St
- 36 Lovering St
- 30 Broken Tree Rd
- 14 Heritage Dr
- 19 Sycamore Way
- 10 Prospect St
- 116 Winthrop St
- 0 Hill St
- 20 Broad St Unit 1
- 20 Broad St Unit 6
- 20 Broad St Unit A
- 20 Broad St Unit 4
- 5 Richardson St
- 7 Hill St
- 140 Goulding St
- 73 Orchard St
- 625 Norfolk St
- 9 Sanford St