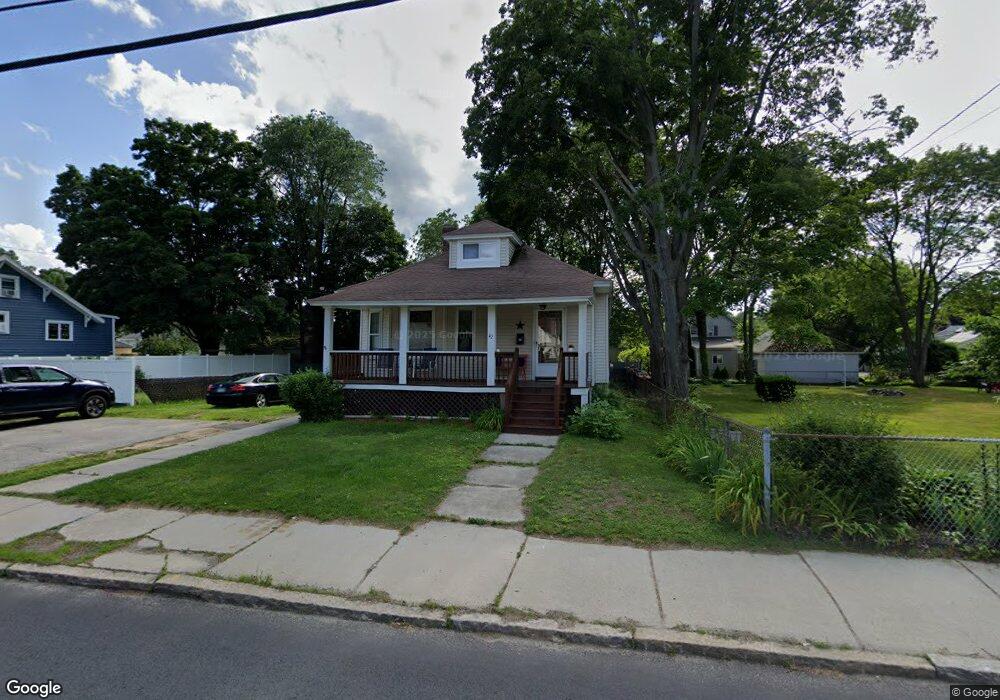
42 Elm St Methuen, MA 01844
Downtown Methuen NeighborhoodEstimated Value: $458,786 - $538,000
2
Beds
1
Bath
1,156
Sq Ft
$425/Sq Ft
Est. Value
About This Home
This home is located at 42 Elm St, Methuen, MA 01844 and is currently estimated at $491,447, approximately $425 per square foot. 42 Elm St is a home located in Essex County with nearby schools including Tenney Grammar School, Methuen High School, and Lawrence Family Development Charter School.
Ownership History
Date
Name
Owned For
Owner Type
Purchase Details
Closed on
Aug 14, 2024
Sold by
Conneilly Scott M
Bought by
Cutts Alisa
Current Estimated Value
Home Financials for this Owner
Home Financials are based on the most recent Mortgage that was taken out on this home.
Original Mortgage
$317,000
Outstanding Balance
$312,853
Interest Rate
6.89%
Mortgage Type
New Conventional
Estimated Equity
$178,594
Purchase Details
Closed on
Oct 22, 1999
Sold by
Lee Wanda V
Bought by
Conneilly Phillip A and Conneilly Nikki M
Create a Home Valuation Report for This Property
The Home Valuation Report is an in-depth analysis detailing your home's value as well as a comparison with similar homes in the area
Home Values in the Area
Average Home Value in this Area
Purchase History
We collect this data history from publicly available records. To have your information removed, we recommend requesting removal directly through your county’s website.
| Date | Buyer | Sale Price | Title Company |
|---|---|---|---|
| Cutts Alisa | -- | None Available | |
| Cutts Alisa | -- | None Available | |
| Cutts Alisa | -- | None Available | |
| Conneilly Phillip A | $130,000 | -- | |
| Conneilly Phillip A | $130,000 | -- |
Source: Public Records
Mortgage History
We collect this data history from publicly available records. To have your information removed, we recommend requesting removal directly through your county’s website.
| Date | Status | Borrower | Loan Amount |
|---|---|---|---|
| Open | Cutts Alisa | $317,000 | |
| Closed | Cutts Alisa | $317,000 | |
| Previous Owner | Conneilly Phillip A | $165,500 | |
| Previous Owner | Conneilly Phillip A | $26,000 |
Source: Public Records
Tax History
| Year | Tax Paid | Tax Assessment Tax Assessment Total Assessment is a certain percentage of the fair market value that is determined by local assessors to be the total taxable value of land and additions on the property. | Land | Improvement |
|---|---|---|---|---|
| 2025 | $4,057 | $383,500 | $190,100 | $193,400 |
| 2024 | $3,821 | $351,800 | $158,400 | $193,400 |
| 2023 | $3,863 | $330,200 | $158,400 | $171,800 |
| 2022 | $3,761 | $288,200 | $129,600 | $158,600 |
| 2021 | $3,560 | $269,900 | $122,400 | $147,500 |
| 2020 | $3,480 | $258,900 | $122,400 | $136,500 |
| 2019 | $3,250 | $229,000 | $115,200 | $113,800 |
| 2018 | $3,059 | $214,400 | $108,000 | $106,400 |
| 2017 | $2,996 | $204,500 | $108,000 | $96,500 |
| 2016 | $2,750 | $185,700 | $93,600 | $92,100 |
| 2015 | $2,711 | $185,700 | $93,600 | $92,100 |
Source: Public Records
Map
Nearby Homes
- 82-84 Haverhill St
- 19 Hideaway Ln
- 8 Glen Forest Ln
- 26 Hobson St
- 13 Caswell Ave
- 945 Riverside Dr Unit 29D
- 4 Capitol St
- 117 Pearl St
- 54 Maplewood Ave
- 65 1/2 Oakland Ave
- 0 Hudson Ave
- 102 Edgewood Ave
- 89 Edgewood Ave
- 40-42 Holly St
- 100 Hancock St
- 4 Chelmsford St
- 202 Broadway Unit 2-3
- 202 Broadway Unit 3-2
- 5 Pearl Ct
- 95 Pelham St Unit 3
Your Personal Tour Guide
Ask me questions while you tour the home.