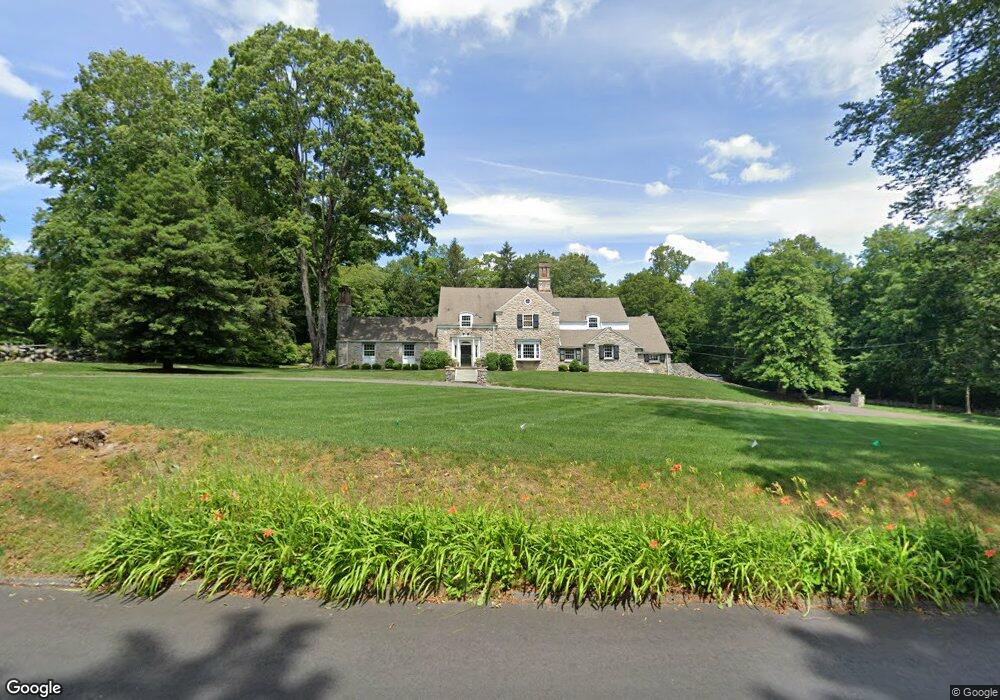
42 Ferris Hill Rd New Canaan, CT 06840
Estimated Value: $2,482,615 - $2,914,000
5
Beds
7
Baths
4,481
Sq Ft
$618/Sq Ft
Est. Value
About This Home
This home is located at 42 Ferris Hill Rd, New Canaan, CT 06840 and is currently estimated at $2,768,904, approximately $617 per square foot. 42 Ferris Hill Rd is a home located in Fairfield County with nearby schools including East Elementary School, Saxe Middle School, and New Canaan High School.
Ownership History
Date
Name
Owned For
Owner Type
Purchase Details
Closed on
Jan 7, 2021
Sold by
Marshall Geoffrey and Marshall Lucinda
Bought by
Odenath Stephanie and Odenath David
Current Estimated Value
Home Financials for this Owner
Home Financials are based on the most recent Mortgage that was taken out on this home.
Original Mortgage
$1,440,000
Outstanding Balance
$1,284,979
Interest Rate
2.7%
Mortgage Type
Purchase Money Mortgage
Estimated Equity
$1,483,925
Purchase Details
Closed on
Dec 14, 2011
Sold by
Us Bank Na
Bought by
Marshall Geoffrey I and Marshall Lucinda K
Home Financials for this Owner
Home Financials are based on the most recent Mortgage that was taken out on this home.
Original Mortgage
$575,000
Interest Rate
4.01%
Purchase Details
Closed on
Aug 8, 2011
Sold by
Merrill Beth J
Bought by
Us Bank Na
Purchase Details
Closed on
Jun 14, 1988
Sold by
Levasseur Carolyn
Bought by
Mayer Charles
Create a Home Valuation Report for This Property
The Home Valuation Report is an in-depth analysis detailing your home's value as well as a comparison with similar homes in the area
Home Values in the Area
Average Home Value in this Area
Purchase History
| Date | Buyer | Sale Price | Title Company |
|---|---|---|---|
| Odenath Stephanie | $1,800,000 | None Available | |
| Marshall Geoffrey I | $1,200,000 | -- | |
| Us Bank Na | -- | -- | |
| Mayer Charles | $1,100,000 | -- |
Source: Public Records
Mortgage History
| Date | Status | Borrower | Loan Amount |
|---|---|---|---|
| Open | Odenath Stephanie | $1,440,000 | |
| Previous Owner | Mayer Charles | $100,000 | |
| Previous Owner | Mayer Charles | $575,000 |
Source: Public Records
Tax History Compared to Growth
Tax History
| Year | Tax Paid | Tax Assessment Tax Assessment Total Assessment is a certain percentage of the fair market value that is determined by local assessors to be the total taxable value of land and additions on the property. | Land | Improvement |
|---|---|---|---|---|
| 2025 | $22,406 | $1,342,460 | $711,900 | $630,560 |
| 2024 | $21,667 | $1,342,460 | $711,900 | $630,560 |
| 2023 | $21,568 | $1,138,760 | $681,800 | $456,960 |
| 2022 | $20,919 | $1,138,760 | $681,800 | $456,960 |
| 2021 | $20,680 | $1,138,760 | $681,800 | $456,960 |
| 2020 | $20,680 | $1,138,760 | $681,800 | $456,960 |
| 2019 | $20,771 | $1,138,760 | $681,800 | $456,960 |
| 2018 | $23,135 | $1,364,090 | $757,610 | $606,480 |
| 2017 | $22,739 | $1,364,090 | $757,610 | $606,480 |
| 2016 | $22,248 | $1,364,090 | $757,610 | $606,480 |
| 2015 | $22,589 | $1,364,090 | $757,610 | $606,480 |
| 2014 | $21,198 | $1,364,090 | $757,610 | $606,480 |
Source: Public Records
Map
Nearby Homes
- 114 Ferris Hill Rd
- 49 Ludlowe Rd
- 240 Rosebrook Rd
- 99 Wardwell Dr
- 30L Huckleberry Hill Rd
- 561 Smith Ridge Rd
- 262 Brushy Ridge Rd
- 122 Brookwood Ln
- 48 Brookwood Ln
- 199 Mariomi Rd
- 52 Garibaldi Ln
- 61 Smith Ridge Rd
- 101 Parade Hill Rd
- 145 River St
- 67 Carter St
- 204 Parade Hill Rd
- 758 Smith Ridge Rd
- 136L Carter St
- 152L Carter St
- 140L Carter St
- 26 Ferris Hill Rd
- 33 Ferris Hill Rd
- 60 Ferris Hill Rd
- 8 Ferris Hill Rd
- 441 Canoe Hill Rd
- 59 Ferris Hill Rd
- 84 Ferris Hill Rd
- 55 Ferris Hill Rd
- 5 Laurel Rd
- 11 Ferris Hill Rd
- 90 Ferris Hill Rd
- 95 Ferris Hill Rd
- 29 Laurel Rd
- 73 Laurel Rd
- 440 Canoe Hill Rd
- 94 Deer Park Rd
- 375 Canoe Hill Rd
- 101 Ferris Hill Rd
- 337 Canoe Hill Rd
- 337 Canoe Hill Rd