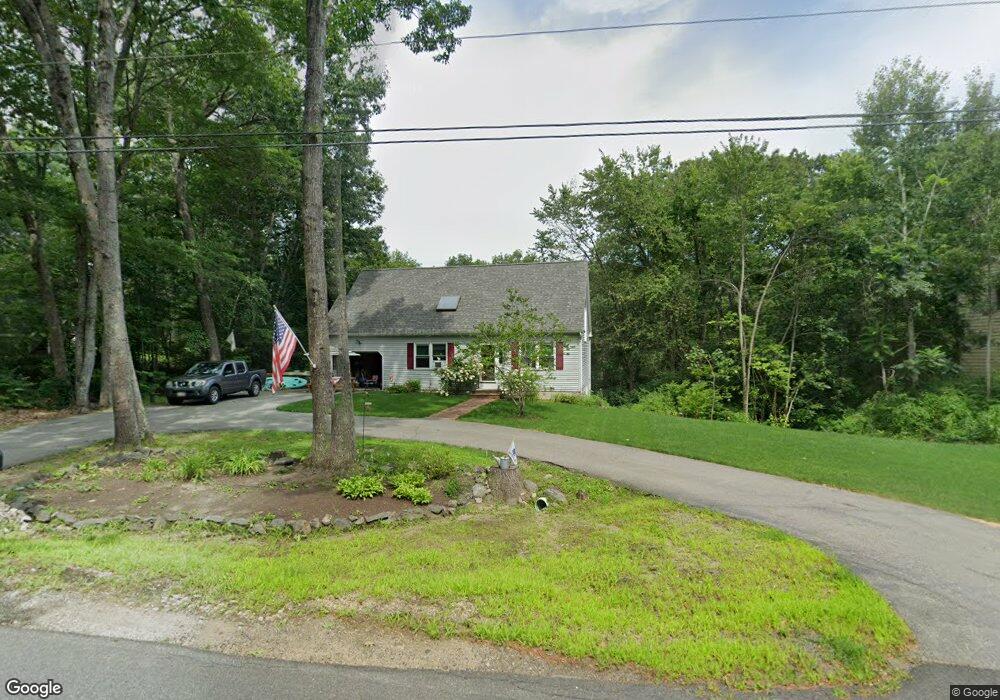
42 Fifes Ln South Berwick, ME 03908
Estimated Value: $533,000 - $690,000
3
Beds
3
Baths
1,832
Sq Ft
$319/Sq Ft
Est. Value
About This Home
This home is located at 42 Fifes Ln, South Berwick, ME 03908 and is currently estimated at $583,692, approximately $318 per square foot. 42 Fifes Ln is a home located in York County with nearby schools including Marshwood High School, Berwick Academy, and Seacoast Christian School.
Ownership History
Date
Name
Owned For
Owner Type
Purchase Details
Closed on
Aug 21, 2014
Sold by
Hilaire Stephen J and Sthilaire Lisa L
Bought by
Johnson Christina N and Burke Sean
Current Estimated Value
Home Financials for this Owner
Home Financials are based on the most recent Mortgage that was taken out on this home.
Original Mortgage
$201,286
Outstanding Balance
$153,652
Interest Rate
4.14%
Mortgage Type
FHA
Estimated Equity
$430,040
Create a Home Valuation Report for This Property
The Home Valuation Report is an in-depth analysis detailing your home's value as well as a comparison with similar homes in the area
Home Values in the Area
Average Home Value in this Area
Purchase History
| Date | Buyer | Sale Price | Title Company |
|---|---|---|---|
| Johnson Christina N | -- | -- |
Source: Public Records
Mortgage History
| Date | Status | Borrower | Loan Amount |
|---|---|---|---|
| Open | Johnson Christina N | $201,286 |
Source: Public Records
Tax History Compared to Growth
Tax History
| Year | Tax Paid | Tax Assessment Tax Assessment Total Assessment is a certain percentage of the fair market value that is determined by local assessors to be the total taxable value of land and additions on the property. | Land | Improvement |
|---|---|---|---|---|
| 2024 | $5,400 | $402,400 | $156,000 | $246,400 |
| 2023 | $4,938 | $353,700 | $136,500 | $217,200 |
| 2022 | $4,504 | $309,800 | $130,000 | $179,800 |
| 2021 | $4,525 | $291,200 | $123,900 | $167,300 |
| 2020 | $4,615 | $263,700 | $109,600 | $154,100 |
| 2019 | $4,597 | $244,500 | $99,700 | $144,800 |
| 2018 | $4,501 | $233,200 | $98,700 | $134,500 |
| 2017 | $4,431 | $233,200 | $98,700 | $134,500 |
| 2016 | $4,268 | $233,200 | $98,700 | $134,500 |
| 2015 | $4,151 | $233,200 | $98,700 | $134,500 |
| 2014 | $4,128 | $233,200 | $98,700 | $134,500 |
Source: Public Records
Map
Nearby Homes