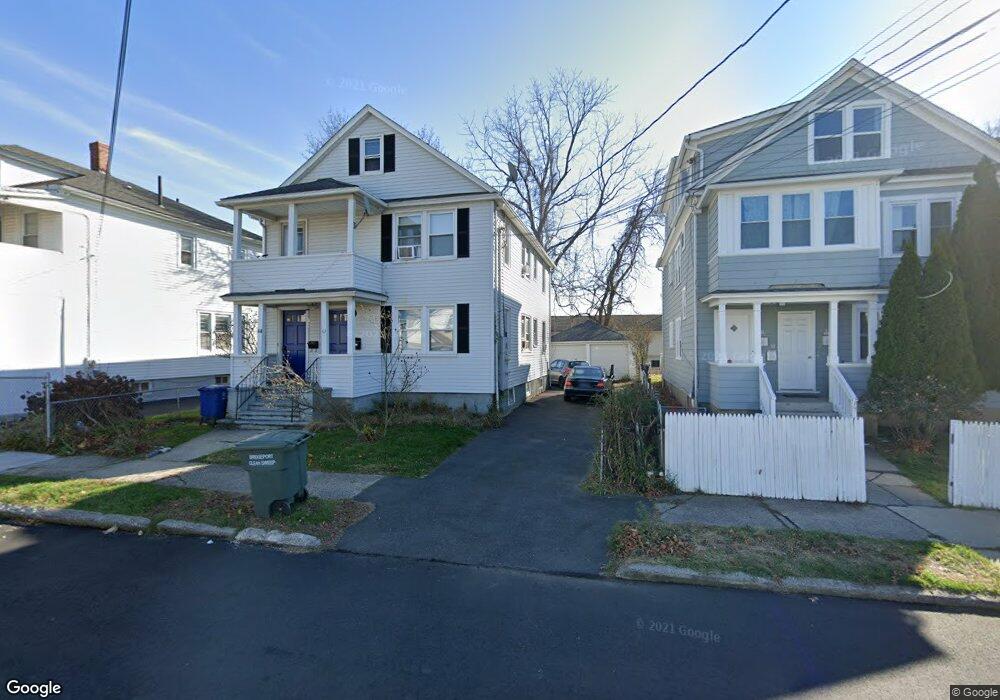
42 Flower St Unit 44 Bridgeport, CT 06605
Black Rock NeighborhoodEstimated Value: $478,561 - $612,000
4
Beds
2
Baths
2,613
Sq Ft
$210/Sq Ft
Est. Value
About This Home
This home is located at 42 Flower St Unit 44, Bridgeport, CT 06605 and is currently estimated at $548,890, approximately $210 per square foot. 42 Flower St Unit 44 is a home located in Fairfield County with nearby schools including Black Rock School, Bassick High School, and New Beginnings Family Academy.
Ownership History
Date
Name
Owned For
Owner Type
Purchase Details
Closed on
Jun 16, 2015
Sold by
Rosten Michael
Bought by
Oh Properties Llc
Current Estimated Value
Purchase Details
Closed on
Oct 27, 2014
Sold by
Foundat Hang Your Hat
Bought by
Rosten Michael
Purchase Details
Closed on
Aug 12, 2003
Sold by
Wynne John B
Bought by
The Hang Y Hat Foundat
Home Financials for this Owner
Home Financials are based on the most recent Mortgage that was taken out on this home.
Original Mortgage
$170,000
Interest Rate
6%
Purchase Details
Closed on
Mar 24, 2003
Sold by
Bank Of New York Tr
Bought by
Wynne John B
Purchase Details
Closed on
Jun 19, 2000
Sold by
Simonetti Carmen
Bought by
Russell Louise
Purchase Details
Closed on
Jun 18, 1996
Sold by
Lobdell William I and Lobdell John H
Bought by
Simonetti Carmen
Create a Home Valuation Report for This Property
The Home Valuation Report is an in-depth analysis detailing your home's value as well as a comparison with similar homes in the area
Home Values in the Area
Average Home Value in this Area
Purchase History
| Date | Buyer | Sale Price | Title Company |
|---|---|---|---|
| Oh Properties Llc | -- | -- | |
| Oh Properties Llc | -- | -- | |
| Rosten Michael | -- | -- | |
| Rosten Michael | -- | -- | |
| The Hang Y Hat Foundat | $258,000 | -- | |
| The Hang Y Hat Foundat | $258,000 | -- | |
| Wynne John B | $180,500 | -- | |
| Wynne John B | $180,500 | -- | |
| Russell Louise | $165,000 | -- | |
| Russell Louise | $165,000 | -- | |
| Simonetti Carmen | $93,100 | -- | |
| Simonetti Carmen | $93,100 | -- |
Source: Public Records
Mortgage History
| Date | Status | Borrower | Loan Amount |
|---|---|---|---|
| Previous Owner | Simonetti Carmen | $170,000 |
Source: Public Records
Tax History Compared to Growth
Tax History
| Year | Tax Paid | Tax Assessment Tax Assessment Total Assessment is a certain percentage of the fair market value that is determined by local assessors to be the total taxable value of land and additions on the property. | Land | Improvement |
|---|---|---|---|---|
| 2025 | $9,062 | $208,560 | $99,450 | $109,110 |
| 2024 | $9,062 | $208,560 | $99,450 | $109,110 |
| 2023 | $9,062 | $208,560 | $99,450 | $109,110 |
| 2022 | $9,062 | $208,560 | $99,450 | $109,110 |
| 2021 | $9,062 | $208,560 | $99,450 | $109,110 |
| 2020 | $8,355 | $154,760 | $64,580 | $90,180 |
| 2019 | $8,355 | $154,760 | $64,580 | $90,180 |
| 2018 | $8,414 | $154,760 | $64,580 | $90,180 |
| 2017 | $8,414 | $154,760 | $64,580 | $90,180 |
| 2016 | $8,414 | $154,760 | $64,580 | $90,180 |
| 2015 | $7,436 | $176,220 | $54,270 | $121,950 |
| 2014 | -- | $176,220 | $54,270 | $121,950 |
Source: Public Records
Map
Nearby Homes
- 167 Scofield Ave
- 166 Alfred St
- 51 Princeton St
- 2773 Fairfield Ave Unit 3
- 855 Brewster St Unit 857
- 37 Rowsley St Unit 6
- 82 Waldorf Ave
- 26 Rowsley St Unit 3
- 20 Haddon St Unit 5
- 554 Brewster St Unit 4
- 165 Bennett St
- 135 Whittier St
- 31 Whittier St
- 222 Ellsworth St
- 25 Whittier St
- 39 Jetland Place Unit 41
- 105 Fox St Unit 107
- 450 Davidson St
- 75 Homestead Ave Unit 77
- 317 Brewster St
- 30 Flower St Unit 34
- 30-34 Flower St
- 48 Flower St
- 24 Flower St Unit 26
- 37 Short St
- 35 Short St
- 18 Short St
- 51 Flower St
- 32 Flower St
- 115 Scofield Ave
- 125 Scofield Ave
- 125 Scofield Ave Unit 1
- 45 Flower St
- 26 Flower St Unit 2
- 136 King St Unit 138
- 136 King St Unit 136 King Street
- 146 King St Unit 148
- 53 Flower St
- 53 Flower St Unit 2
- 138 King St