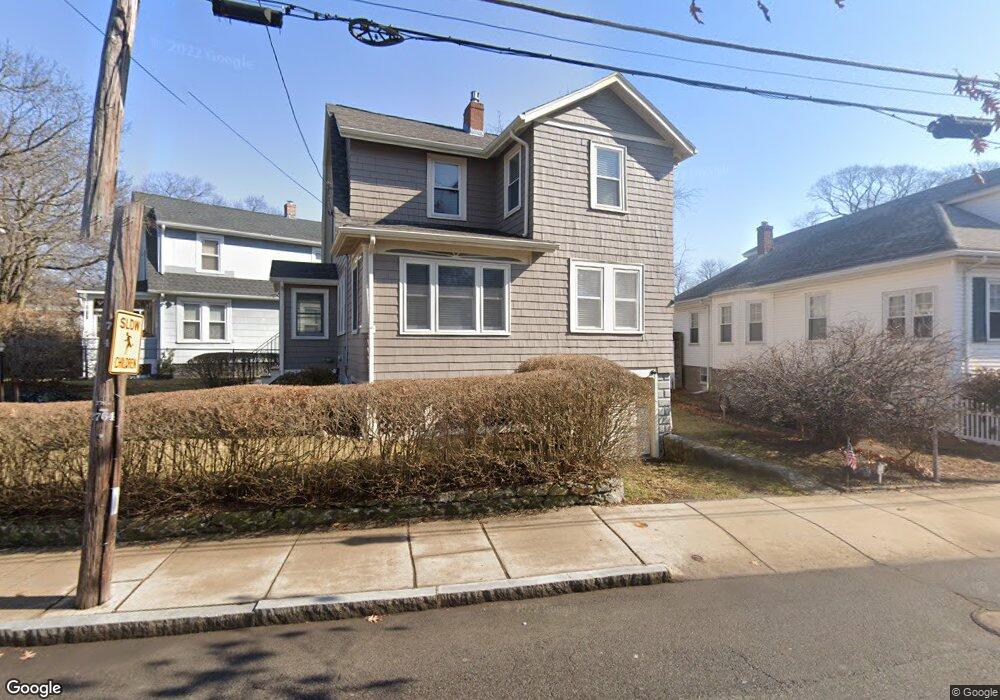
42 Foss St Medford, MA 02155
North Medford NeighborhoodEstimated Value: $678,000 - $723,000
3
Beds
2
Baths
1,320
Sq Ft
$531/Sq Ft
Est. Value
About This Home
This home is located at 42 Foss St, Medford, MA 02155 and is currently estimated at $700,551, approximately $530 per square foot. 42 Foss St is a home located in Middlesex County with nearby schools including Medford High School, Mystic Valley Regional Charter School, and St. Joseph School.
Ownership History
Date
Name
Owned For
Owner Type
Purchase Details
Closed on
Sep 25, 2009
Sold by
Randall Kerri Lynne and Mccomiskey Kerri Lynne
Bought by
Galvin Mary and Hall James G
Current Estimated Value
Home Financials for this Owner
Home Financials are based on the most recent Mortgage that was taken out on this home.
Original Mortgage
$202,000
Interest Rate
5.31%
Mortgage Type
Purchase Money Mortgage
Purchase Details
Closed on
May 31, 2005
Sold by
Errico Michael W and Errico Victoria M
Bought by
Randall Denis and Mccomiskey Kerri Lynne
Home Financials for this Owner
Home Financials are based on the most recent Mortgage that was taken out on this home.
Original Mortgage
$320,000
Interest Rate
5.94%
Mortgage Type
Purchase Money Mortgage
Purchase Details
Closed on
May 6, 1998
Sold by
Lee Thomas J and Lee Jeanette A
Bought by
Benassi Giordana S and Benassi Joseph
Home Financials for this Owner
Home Financials are based on the most recent Mortgage that was taken out on this home.
Original Mortgage
$110,600
Interest Rate
7.05%
Mortgage Type
Purchase Money Mortgage
Purchase Details
Closed on
May 4, 1988
Sold by
Sullivan Barbara
Bought by
Lee Thomas J
Home Financials for this Owner
Home Financials are based on the most recent Mortgage that was taken out on this home.
Original Mortgage
$120,000
Interest Rate
9.94%
Mortgage Type
Purchase Money Mortgage
Create a Home Valuation Report for This Property
The Home Valuation Report is an in-depth analysis detailing your home's value as well as a comparison with similar homes in the area
Home Values in the Area
Average Home Value in this Area
Purchase History
| Date | Buyer | Sale Price | Title Company |
|---|---|---|---|
| Galvin Mary | $349,900 | -- | |
| Randall Denis | $400,000 | -- | |
| Benassi Giordana S | $158,000 | -- | |
| Lee Thomas J | $152,500 | -- |
Source: Public Records
Mortgage History
| Date | Status | Borrower | Loan Amount |
|---|---|---|---|
| Closed | Lee Thomas J | $142,000 | |
| Closed | Galvin Mary | $202,000 | |
| Previous Owner | Randall Denis | $320,000 | |
| Previous Owner | Lee Thomas J | $110,600 | |
| Previous Owner | Lee Thomas J | $118,000 | |
| Previous Owner | Lee Thomas J | $120,000 |
Source: Public Records
Tax History Compared to Growth
Tax History
| Year | Tax Paid | Tax Assessment Tax Assessment Total Assessment is a certain percentage of the fair market value that is determined by local assessors to be the total taxable value of land and additions on the property. | Land | Improvement |
|---|---|---|---|---|
| 2025 | $4,791 | $562,300 | $298,300 | $264,000 |
| 2024 | $4,791 | $562,300 | $298,300 | $264,000 |
| 2023 | $4,561 | $527,300 | $278,800 | $248,500 |
| 2022 | $4,443 | $493,100 | $253,400 | $239,700 |
| 2021 | $4,297 | $456,600 | $241,300 | $215,300 |
| 2020 | $4,212 | $458,800 | $241,300 | $217,500 |
| 2019 | $4,022 | $419,000 | $219,400 | $199,600 |
| 2018 | $3,951 | $385,800 | $199,500 | $186,300 |
| 2017 | $3,822 | $361,900 | $186,400 | $175,500 |
| 2016 | $3,530 | $315,500 | $169,500 | $146,000 |
| 2015 | $3,422 | $292,500 | $161,400 | $131,100 |
Source: Public Records
Map
Nearby Homes