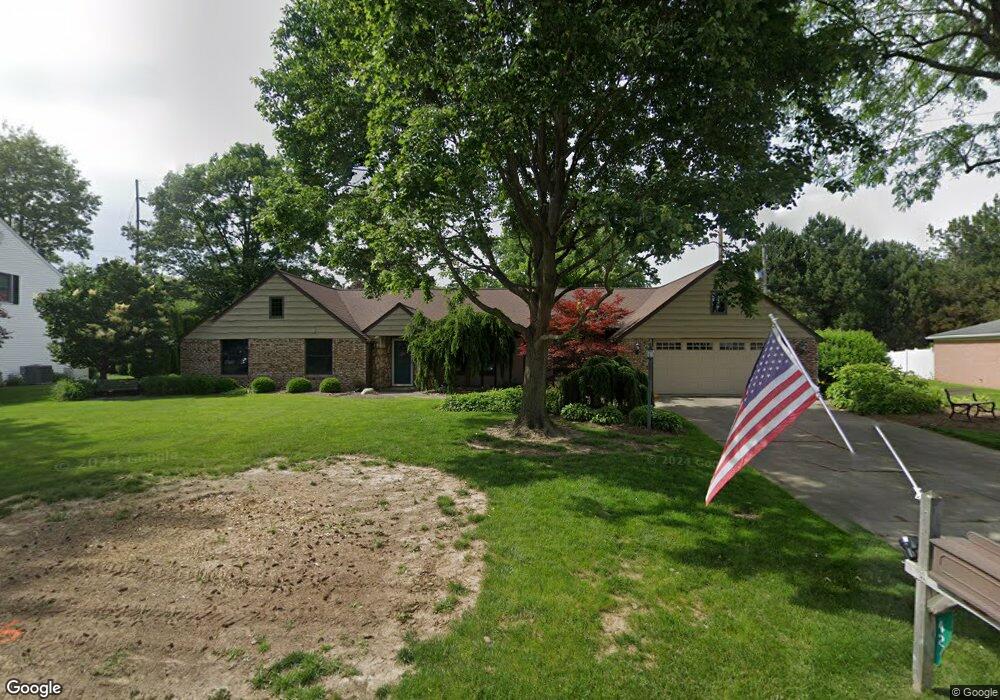
42 Glendale Ave Fremont, OH 43420
Estimated Value: $275,621 - $336,000
3
Beds
3
Baths
2,582
Sq Ft
$120/Sq Ft
Est. Value
About This Home
This home is located at 42 Glendale Ave, Fremont, OH 43420 and is currently estimated at $310,655, approximately $120 per square foot. 42 Glendale Ave is a home located in Sandusky County with nearby schools including Fremont Ross High School, St. Joseph School, and Bishop Hoffman Catholic School - This is St Joe's School now.
Ownership History
Date
Name
Owned For
Owner Type
Purchase Details
Closed on
Nov 25, 2003
Sold by
Gaydos Diane C and Gaydos Paul
Bought by
Wethington Norbert A and Wethington Martha M
Current Estimated Value
Home Financials for this Owner
Home Financials are based on the most recent Mortgage that was taken out on this home.
Original Mortgage
$167,000
Outstanding Balance
$69,870
Interest Rate
4.5%
Mortgage Type
Purchase Money Mortgage
Estimated Equity
$240,785
Purchase Details
Closed on
May 1, 1993
Sold by
Gaydos Diane C
Bought by
Wethington Norbert A and Wethington Martha M
Purchase Details
Closed on
Dec 1, 1990
Sold by
Gaydos Diane C
Bought by
Wethington Norbert A and Wethington Martha M
Purchase Details
Closed on
May 1, 1986
Sold by
Gaydos Diane C
Bought by
Wethington Norbert A and Wethington Martha M
Purchase Details
Closed on
Mar 1, 1984
Bought by
Wethington Norbert A and Wethington Martha M
Create a Home Valuation Report for This Property
The Home Valuation Report is an in-depth analysis detailing your home's value as well as a comparison with similar homes in the area
Home Values in the Area
Average Home Value in this Area
Purchase History
| Date | Buyer | Sale Price | Title Company |
|---|---|---|---|
| Wethington Norbert A | $168,750 | Midland Title | |
| Wethington Norbert A | -- | -- | |
| Wethington Norbert A | $113,000 | -- | |
| Wethington Norbert A | $101,500 | -- | |
| Wethington Norbert A | $98,500 | -- |
Source: Public Records
Mortgage History
| Date | Status | Borrower | Loan Amount |
|---|---|---|---|
| Open | Wethington Norbert A | $167,000 |
Source: Public Records
Tax History Compared to Growth
Tax History
| Year | Tax Paid | Tax Assessment Tax Assessment Total Assessment is a certain percentage of the fair market value that is determined by local assessors to be the total taxable value of land and additions on the property. | Land | Improvement |
|---|---|---|---|---|
| 2024 | $2,654 | $78,090 | $11,030 | $67,060 |
| 2023 | $2,654 | $66,750 | $9,420 | $57,330 |
| 2022 | $2,407 | $66,750 | $9,420 | $57,330 |
| 2021 | $2,480 | $66,750 | $9,420 | $57,330 |
| 2020 | $2,191 | $58,980 | $9,420 | $49,560 |
| 2019 | $2,189 | $58,980 | $9,420 | $49,560 |
| 2018 | $2,130 | $58,980 | $9,420 | $49,560 |
| 2017 | $1,865 | $52,510 | $9,420 | $43,090 |
| 2016 | $1,635 | $52,510 | $9,420 | $43,090 |
| 2015 | $1,608 | $52,510 | $9,420 | $43,090 |
| 2014 | $1,731 | $53,870 | $9,310 | $44,560 |
| 2013 | $1,695 | $53,870 | $9,310 | $44,560 |
Source: Public Records
Map
Nearby Homes
- 1719 Buckland Ave
- 2484 Buckland Ave
- 1485 Autumn Woods Dr
- 1420 Center St
- 1611 Mcpherson Blvd
- 10 Meadowbrook Dr
- 10 Meadowbrook Ln
- 64 River Run Dr Unit J
- 1028 June St
- 1013 Whittlesey St
- 515 Everett Rd
- 905 Twinn St
- 1015 Hayes Ave
- 1037 Buckland Ave
- 2119 Lake St
- 815 South St
- 616 S Wood St
- 135 Briarwood Cir
- 625 Bush Place
- 1009 Napoleon St