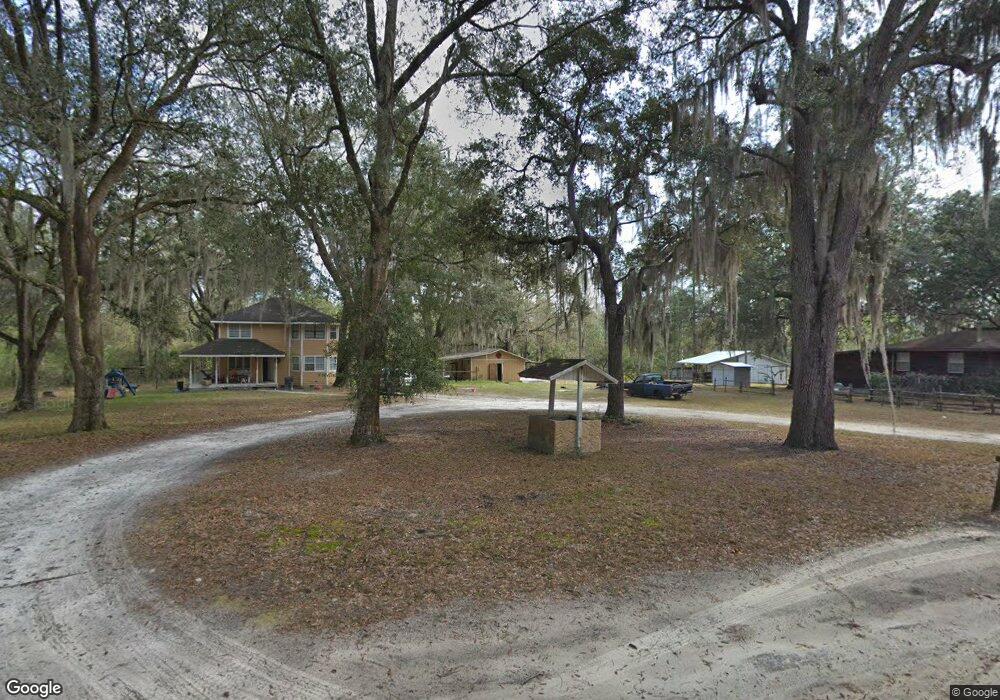
42 Graham Ln Saint George, GA 31562
Estimated Value: $146,000 - $238,000
3
Beds
2
Baths
1,980
Sq Ft
$100/Sq Ft
Est. Value
About This Home
This home is located at 42 Graham Ln, Saint George, GA 31562 and is currently estimated at $198,492, approximately $100 per square foot. 42 Graham Ln is a home with nearby schools including Charlton County High School.
Ownership History
Date
Name
Owned For
Owner Type
Purchase Details
Closed on
Dec 23, 2008
Sold by
Fnb South
Bought by
Jan Investment Group Inc
Current Estimated Value
Purchase Details
Closed on
Sep 22, 2008
Sold by
Wright William P
Bought by
Fnb South
Purchase Details
Closed on
Jun 9, 2006
Sold by
Kight Yvette
Bought by
Wright William P
Purchase Details
Closed on
Feb 12, 2005
Sold by
Wingate Rodney Bruce
Bought by
Kight Yvette
Purchase Details
Closed on
Jun 7, 2002
Sold by
Manufacture & Trust Co
Bought by
Knight Yvette and Knight Bruce
Purchase Details
Closed on
Nov 5, 2001
Sold by
Contimortgage Corporatio
Bought by
Manufacture & Trust Co
Purchase Details
Closed on
Jun 23, 2000
Sold by
Atkins Richard B
Bought by
Contimortgage Corporatio
Purchase Details
Closed on
Aug 30, 1994
Bought by
Atkins Richard B
Purchase Details
Closed on
Jun 10, 1991
Bought by
Johnson Lonnie Robert
Purchase Details
Closed on
Nov 3, 1987
Bought by
Combs Jimmy
Create a Home Valuation Report for This Property
The Home Valuation Report is an in-depth analysis detailing your home's value as well as a comparison with similar homes in the area
Home Values in the Area
Average Home Value in this Area
Purchase History
| Date | Buyer | Sale Price | Title Company |
|---|---|---|---|
| Jan Investment Group Inc | $70,000 | -- | |
| Fnb South | -- | -- | |
| Wright William P | $49,250 | -- | |
| Kight Yvette | -- | -- | |
| Knight Yvette | -- | -- | |
| Manufacture & Trust Co | -- | -- | |
| Contimortgage Corporatio | -- | -- | |
| Atkins Richard B | $68,500 | -- | |
| Johnson Lonnie Robert | $65,000 | -- | |
| Combs Jimmy | -- | -- |
Source: Public Records
Tax History Compared to Growth
Tax History
| Year | Tax Paid | Tax Assessment Tax Assessment Total Assessment is a certain percentage of the fair market value that is determined by local assessors to be the total taxable value of land and additions on the property. | Land | Improvement |
|---|---|---|---|---|
| 2024 | $1,715 | $59,432 | $1,880 | $57,552 |
| 2023 | $1,690 | $59,432 | $1,880 | $57,552 |
| 2022 | $1,431 | $46,792 | $1,800 | $44,992 |
| 2021 | $1,319 | $34,080 | $1,800 | $32,280 |
| 2020 | $1,214 | $34,080 | $1,800 | $32,280 |
| 2019 | $1,319 | $34,080 | $1,800 | $32,280 |
| 2018 | $1,397 | $35,800 | $3,520 | $32,280 |
| 2017 | $1,276 | $35,000 | $3,520 | $31,480 |
| 2016 | $1,345 | $35,000 | $3,520 | $31,480 |
| 2015 | -- | $35,000 | $3,520 | $31,480 |
| 2014 | -- | $35,000 | $3,520 | $31,480 |
| 2013 | -- | $35,000 | $3,520 | $31,480 |
Source: Public Records
Map
Nearby Homes
- 12 Thirteenth Ave
- 2199 Tom Crawford Rd
- 0 Tom Crawford Rd Unit 2110307
- 264 & 220 Wheat St
- 264 Wheat St
- LOT 8 Emmaus Church Rd
- 845 Emmaus Church Rd
- 0 Emmaus Church Rd Unit 23810531
- 0 Emmaus Church Rd Unit 21761735
- 2721 Barbara Ln
- 14709 Howard Rd
- LOT 11 Emmaus-Barker Rd
- LOT 10 Emmaus-Barker Rd
- LOT 18 Emmaus-Barker Rd
- LOT 17 Emmaus-Barker Rd
- LOT 20 Emmaus-Barker Rd
- LOT 14 Emmaus-Barker Rd
- LOT 15 Emmaus-Barker Rd
- LOT 9 Rd
- LOT 13 Emmaus-Barker Rd
- 98 Graham Ln
- 14 Graham Ln
- 103 Creek Landing Rd
- 103 Graham Ln
- 103 Creek Landing Rd
- 188 Saint Marys Dr
- 188 St Marys Dr
- 190 Saint Marys Dr
- 108 Creek Landing Rd
- 451 St Marys Loop
- 227 Creek Landing Rd
- 1147 Wheeler St
- 16 St Marys Dr
- 87 St Marys Dr
- 436 Russell Blvd
- 526 Bragg St
- 510 Bragg St
- 354 Russell Blvd
- 461 St Marys Loop
- 272 Russell Blvd