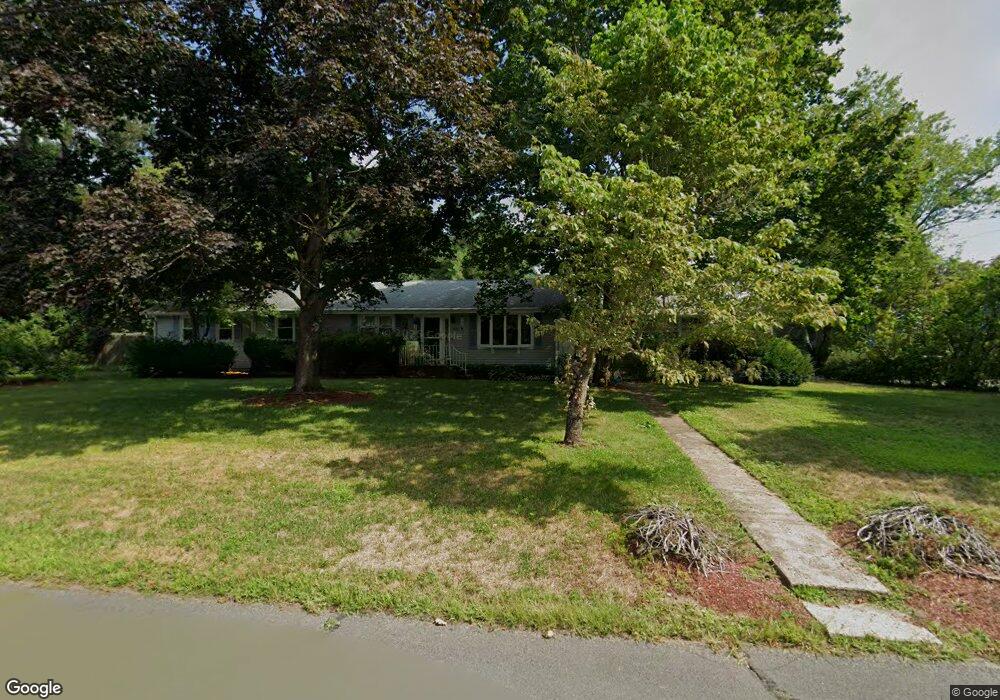
42 Granite St North Attleboro, MA 02760
North Attleboro NeighborhoodEstimated Value: $615,000 - $696,457
2
Beds
2
Baths
1,992
Sq Ft
$334/Sq Ft
Est. Value
About This Home
This home is located at 42 Granite St, North Attleboro, MA 02760 and is currently estimated at $664,614, approximately $333 per square foot. 42 Granite St is a home located in Bristol County with nearby schools including North Attleboro High School, Cadence Academy Preschool - North Attleborough, and Bishop Feehan High School.
Ownership History
Date
Name
Owned For
Owner Type
Purchase Details
Closed on
Apr 19, 1996
Sold by
Baker St Rt
Bought by
Garcia Francisco
Current Estimated Value
Home Financials for this Owner
Home Financials are based on the most recent Mortgage that was taken out on this home.
Original Mortgage
$115,500
Outstanding Balance
$5,431
Interest Rate
7.34%
Mortgage Type
Purchase Money Mortgage
Estimated Equity
$659,183
Purchase Details
Closed on
Jan 1, 1975
Bought by
Kelley Theodore G and Kelley Suzanne D
Create a Home Valuation Report for This Property
The Home Valuation Report is an in-depth analysis detailing your home's value as well as a comparison with similar homes in the area
Home Values in the Area
Average Home Value in this Area
Purchase History
| Date | Buyer | Sale Price | Title Company |
|---|---|---|---|
| Garcia Francisco | $77,000 | -- | |
| Kelley Theodore G | -- | -- |
Source: Public Records
Mortgage History
| Date | Status | Borrower | Loan Amount |
|---|---|---|---|
| Open | Kelley Theodore G | $115,500 |
Source: Public Records
Tax History Compared to Growth
Tax History
| Year | Tax Paid | Tax Assessment Tax Assessment Total Assessment is a certain percentage of the fair market value that is determined by local assessors to be the total taxable value of land and additions on the property. | Land | Improvement |
|---|---|---|---|---|
| 2025 | $7,107 | $602,800 | $149,300 | $453,500 |
| 2024 | $6,707 | $581,200 | $149,300 | $431,900 |
| 2023 | $6,346 | $496,200 | $149,300 | $346,900 |
| 2022 | $5,752 | $412,900 | $149,300 | $263,600 |
| 2021 | $6,145 | $430,600 | $149,300 | $281,300 |
| 2020 | $5,740 | $400,000 | $149,300 | $250,700 |
| 2019 | $5,548 | $389,600 | $135,700 | $253,900 |
| 2018 | $4,832 | $362,200 | $135,700 | $226,500 |
| 2017 | $4,643 | $351,200 | $135,700 | $215,500 |
| 2016 | $4,404 | $333,100 | $150,700 | $182,400 |
| 2015 | $4,175 | $317,700 | $150,700 | $167,000 |
| 2014 | $3,947 | $298,100 | $132,400 | $165,700 |
Source: Public Records
Map
Nearby Homes
- 16 Raymond Hall Dr
- 10 Sleepy Hollow Cir
- 11 Landry Ave
- 116 George St
- 15 Old Wood Rd
- 57 Vine St
- Lot 5 Jeffrey Dr
- Lot 2 Jeffrey Dr
- 115 Westfield Dr
- 17 Peters Way
- 28 Messenger St
- 36 Cranberry Rd
- 1730 West St
- 2 George St Unit C
- 33 Dublin Way
- 122 Mary Ann Way
- 47 Old Farm Rd
- 166 E Bacon St Unit 4
- 12 Houde St
- 24 Red Coat Ln