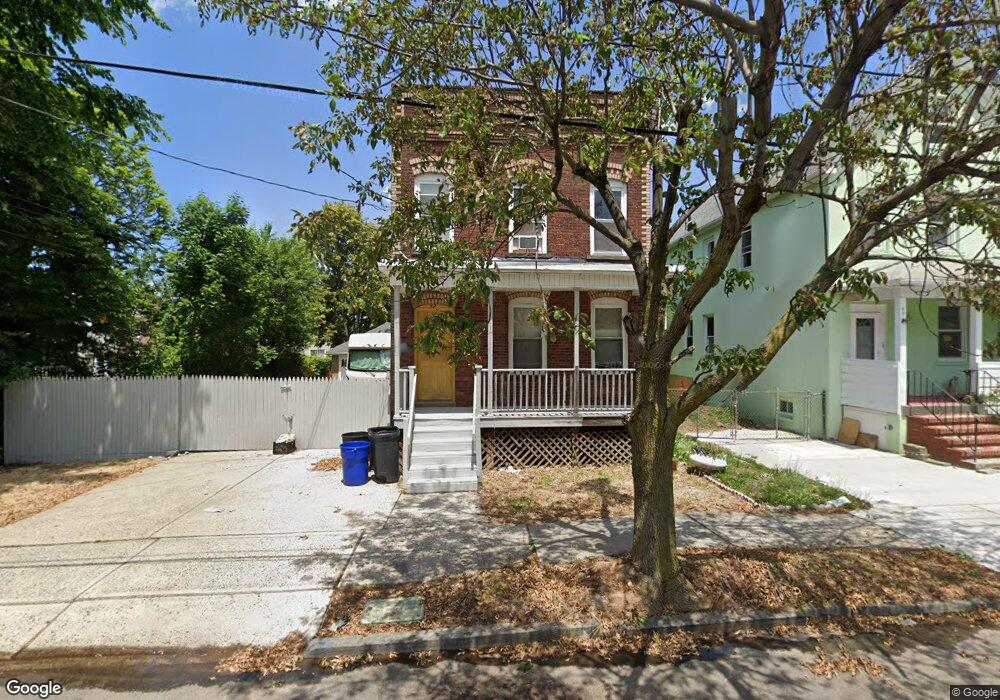
42 Grant Ave Unit 1 Carteret, NJ 07008
Estimated Value: $519,000 - $654,000
1
Bed
1
Bath
1,504
Sq Ft
$385/Sq Ft
Est. Value
About This Home
This home is located at 42 Grant Ave Unit 1, Carteret, NJ 07008 and is currently estimated at $578,943, approximately $384 per square foot. 42 Grant Ave Unit 1 is a home located in Middlesex County with nearby schools including Carteret High School and St Joseph School.
Ownership History
Date
Name
Owned For
Owner Type
Purchase Details
Closed on
Jul 17, 2025
Sold by
Saini Leo Kumar
Bought by
Binty Peggy Trust and Saini
Current Estimated Value
Purchase Details
Closed on
Nov 29, 2016
Sold by
Prof 2013 S3 Legal Title Trust
Bought by
Saini Leo Kumar
Purchase Details
Closed on
Oct 7, 2015
Sold by
Vira Madeline and Vira Albert N
Bought by
Bac Home Loans Servicing Lp
Purchase Details
Closed on
Sep 7, 1994
Sold by
Nadal Pauline
Bought by
Vira Albert and Vira Madeline
Create a Home Valuation Report for This Property
The Home Valuation Report is an in-depth analysis detailing your home's value as well as a comparison with similar homes in the area
Home Values in the Area
Average Home Value in this Area
Purchase History
| Date | Buyer | Sale Price | Title Company |
|---|---|---|---|
| Binty Peggy Trust | -- | None Listed On Document | |
| Binty Peggy Trust | -- | None Listed On Document | |
| Saini Leo Kumar | $171,150 | Coastal Title Agency Inc | |
| Bac Home Loans Servicing Lp | $100 | None Available | |
| Vira Albert | $75,000 | -- |
Source: Public Records
Tax History Compared to Growth
Tax History
| Year | Tax Paid | Tax Assessment Tax Assessment Total Assessment is a certain percentage of the fair market value that is determined by local assessors to be the total taxable value of land and additions on the property. | Land | Improvement |
|---|---|---|---|---|
| 2025 | $7,699 | $621,300 | $298,800 | $322,500 |
| 2024 | $7,501 | $241,500 | $95,000 | $146,500 |
| 2023 | $7,501 | $241,500 | $95,000 | $146,500 |
| 2022 | $7,293 | $241,500 | $95,000 | $146,500 |
| 2021 | $5,344 | $241,500 | $95,000 | $146,500 |
| 2020 | $6,946 | $241,500 | $95,000 | $146,500 |
| 2019 | $6,745 | $241,500 | $95,000 | $146,500 |
| 2018 | $6,586 | $241,500 | $95,000 | $146,500 |
| 2017 | $6,351 | $241,500 | $95,000 | $146,500 |
| 2016 | $6,572 | $207,500 | $65,000 | $142,500 |
| 2015 | $6,476 | $207,500 | $65,000 | $142,500 |
| 2014 | $6,194 | $207,500 | $65,000 | $142,500 |
Source: Public Records
Map
Nearby Homes