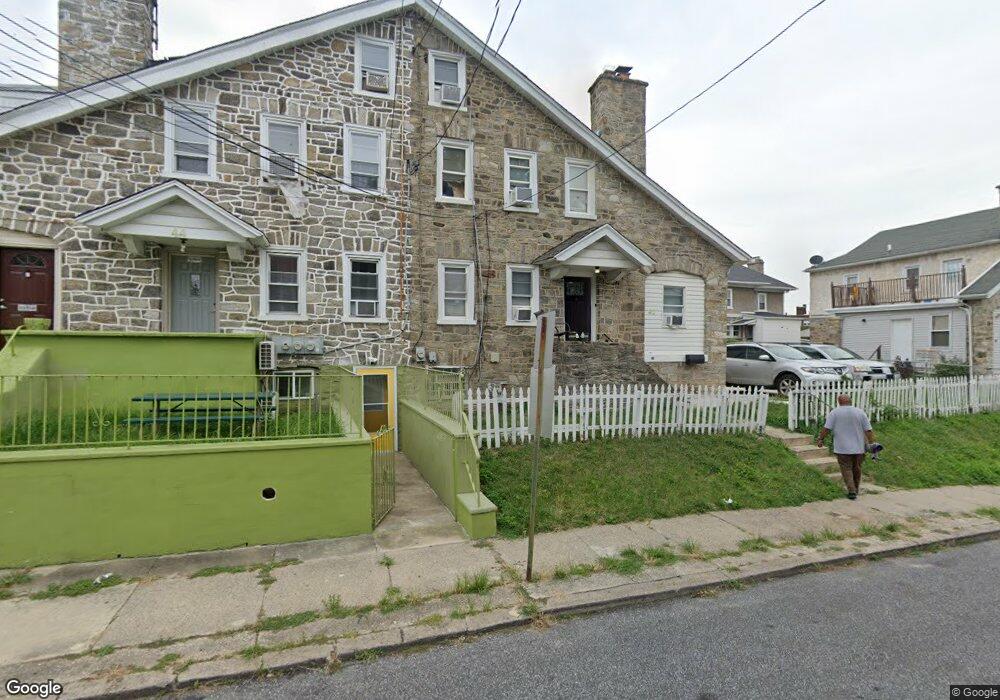
42 Hampden Rd Upper Darby, PA 19082
Estimated Value: $243,000 - $290,000
3
Beds
1
Bath
1,921
Sq Ft
$136/Sq Ft
Est. Value
About This Home
This home is located at 42 Hampden Rd, Upper Darby, PA 19082 and is currently estimated at $261,834, approximately $136 per square foot. 42 Hampden Rd is a home located in Delaware County with nearby schools including Bywood Elementary School, Upper Darby Kdg Center, and Upper Darby High School.
Ownership History
Date
Name
Owned For
Owner Type
Purchase Details
Closed on
Sep 30, 2020
Sold by
Vasudevan Narayanan and Vasudevan Yesodhara
Bought by
Jean Lesly
Current Estimated Value
Home Financials for this Owner
Home Financials are based on the most recent Mortgage that was taken out on this home.
Original Mortgage
$147,283
Outstanding Balance
$131,000
Interest Rate
2.9%
Mortgage Type
FHA
Estimated Equity
$130,834
Purchase Details
Closed on
Dec 20, 1996
Sold by
Posse Alice
Bought by
Vasudevan Narayanan and Yesodhara Vasudevan
Purchase Details
Closed on
Jan 13, 1994
Sold by
Cannon Elizabeth Ann
Bought by
Cannon Harry
Create a Home Valuation Report for This Property
The Home Valuation Report is an in-depth analysis detailing your home's value as well as a comparison with similar homes in the area
Home Values in the Area
Average Home Value in this Area
Purchase History
| Date | Buyer | Sale Price | Title Company |
|---|---|---|---|
| Jean Lesly | $150,000 | Suburban Abstract Agency Inc | |
| Vasudevan Narayanan | $62,500 | -- | |
| Cannon Harry | -- | -- |
Source: Public Records
Mortgage History
| Date | Status | Borrower | Loan Amount |
|---|---|---|---|
| Open | Jean Lesly | $147,283 |
Source: Public Records
Tax History Compared to Growth
Tax History
| Year | Tax Paid | Tax Assessment Tax Assessment Total Assessment is a certain percentage of the fair market value that is determined by local assessors to be the total taxable value of land and additions on the property. | Land | Improvement |
|---|---|---|---|---|
| 2025 | $5,268 | $124,570 | $31,700 | $92,870 |
| 2024 | $5,268 | $124,570 | $31,700 | $92,870 |
| 2023 | $5,219 | $124,570 | $31,700 | $92,870 |
| 2022 | $5,078 | $124,570 | $31,700 | $92,870 |
| 2021 | $6,847 | $124,570 | $31,700 | $92,870 |
| 2020 | $3,948 | $61,040 | $18,740 | $42,300 |
| 2019 | $3,879 | $61,040 | $18,740 | $42,300 |
| 2018 | $3,834 | $61,040 | $0 | $0 |
| 2017 | $3,735 | $61,040 | $0 | $0 |
| 2016 | $335 | $61,040 | $0 | $0 |
| 2015 | $335 | $61,040 | $0 | $0 |
| 2014 | $335 | $61,040 | $0 | $0 |
Source: Public Records
Map
Nearby Homes
- 27 Glendale Rd
- 62 Richfield Rd
- 101 Copley Rd
- 42 Kent Rd
- 53 N Keystone Ave
- 77 N Keystone Ave
- 7252 Brent Rd
- 134 Heather Rd
- 240 Glendale Rd
- 34 N Keystone Ave
- 214 Kingston Rd
- 7281 Walnut St
- 268 Hampden Rd
- 271 Wembly Rd
- 27 Wellington Rd
- 228 Long Ln
- 513 Spruce Ave
- 234 Long Ln
- 512 Fairfield Ave
- 212 Huntley Rd