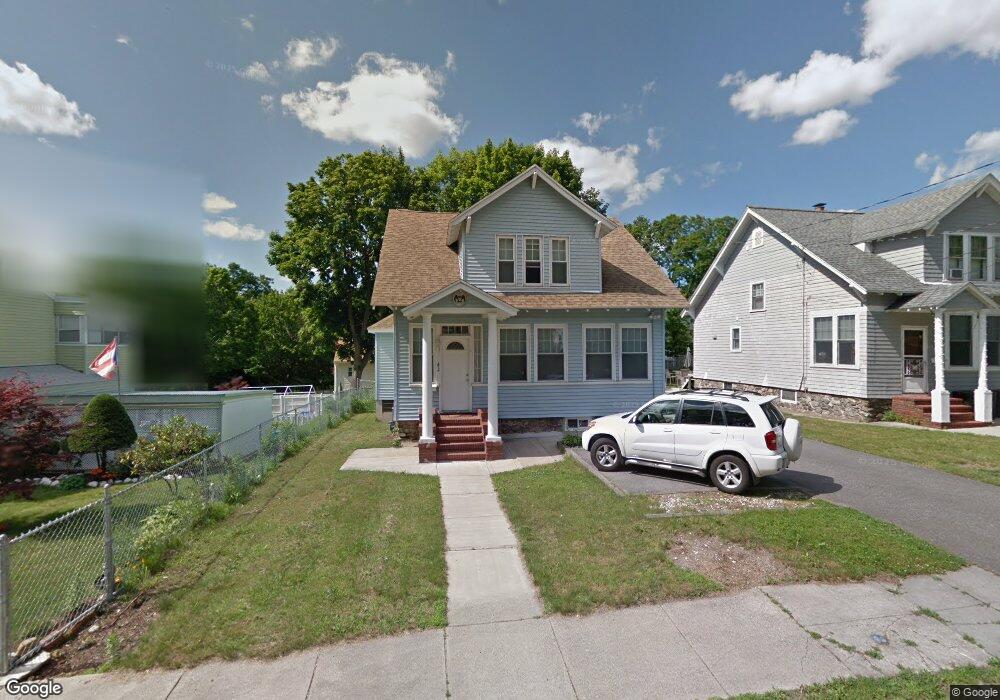
42 Hardy St Methuen, MA 01844
Arlington NeighborhoodEstimated Value: $526,561 - $557,000
3
Beds
2
Baths
1,702
Sq Ft
$316/Sq Ft
Est. Value
About This Home
This home is located at 42 Hardy St, Methuen, MA 01844 and is currently estimated at $538,640, approximately $316 per square foot. 42 Hardy St is a home located in Essex County with nearby schools including Mendota Elementary School, Tenney Grammar School, and South Point Elementary School.
Ownership History
Date
Name
Owned For
Owner Type
Purchase Details
Closed on
Mar 28, 2002
Sold by
Coletta Albert A and Coletta Gisele M
Bought by
Gonzalez Belky and Gonzalez Fidel
Current Estimated Value
Home Financials for this Owner
Home Financials are based on the most recent Mortgage that was taken out on this home.
Original Mortgage
$178,487
Interest Rate
6.88%
Mortgage Type
Purchase Money Mortgage
Create a Home Valuation Report for This Property
The Home Valuation Report is an in-depth analysis detailing your home's value as well as a comparison with similar homes in the area
Home Values in the Area
Average Home Value in this Area
Purchase History
| Date | Buyer | Sale Price | Title Company |
|---|---|---|---|
| Gonzalez Belky | $179,000 | -- | |
| Gonzalez Belky | $179,000 | -- |
Source: Public Records
Mortgage History
| Date | Status | Borrower | Loan Amount |
|---|---|---|---|
| Open | Gonzalez Belky | $178,234 | |
| Closed | Gonzalez Belky | $178,487 |
Source: Public Records
Tax History Compared to Growth
Tax History
| Year | Tax Paid | Tax Assessment Tax Assessment Total Assessment is a certain percentage of the fair market value that is determined by local assessors to be the total taxable value of land and additions on the property. | Land | Improvement |
|---|---|---|---|---|
| 2025 | $4,714 | $445,600 | $188,800 | $256,800 |
| 2024 | $4,626 | $426,000 | $169,200 | $256,800 |
| 2023 | $4,377 | $374,100 | $149,700 | $224,400 |
| 2022 | $4,109 | $314,900 | $117,200 | $197,700 |
| 2021 | $3,855 | $292,300 | $110,700 | $181,600 |
| 2020 | $3,732 | $277,700 | $104,100 | $173,600 |
| 2019 | $3,522 | $248,200 | $97,600 | $150,600 |
| 2018 | $3,429 | $240,300 | $97,600 | $142,700 |
| 2017 | $3,189 | $217,700 | $91,100 | $126,600 |
| 2016 | $3,128 | $211,200 | $84,600 | $126,600 |
| 2015 | $2,739 | $187,600 | $70,300 | $117,300 |
Source: Public Records
Map
Nearby Homes
- 35 Hardy St
- 100-102 Phillips St
- 2 Horne St
- 69 Broadway
- 18 Larchwood Rd
- 23 Chase St
- 24 Railroad St
- 48 Larchwood Rd
- 2 Lawrence St
- 364 Lawrence St
- 82 Oakside Ave
- 87 Oakside Ave
- 83 Oakside Ave
- 20-22 Ashland Ave
- 5 Arlington Terrace
- 434-438 Hampshire St
- 47 Lowell St
- 83 Arnold St
- 29 Willow St Unit B
- 27 Exchange St