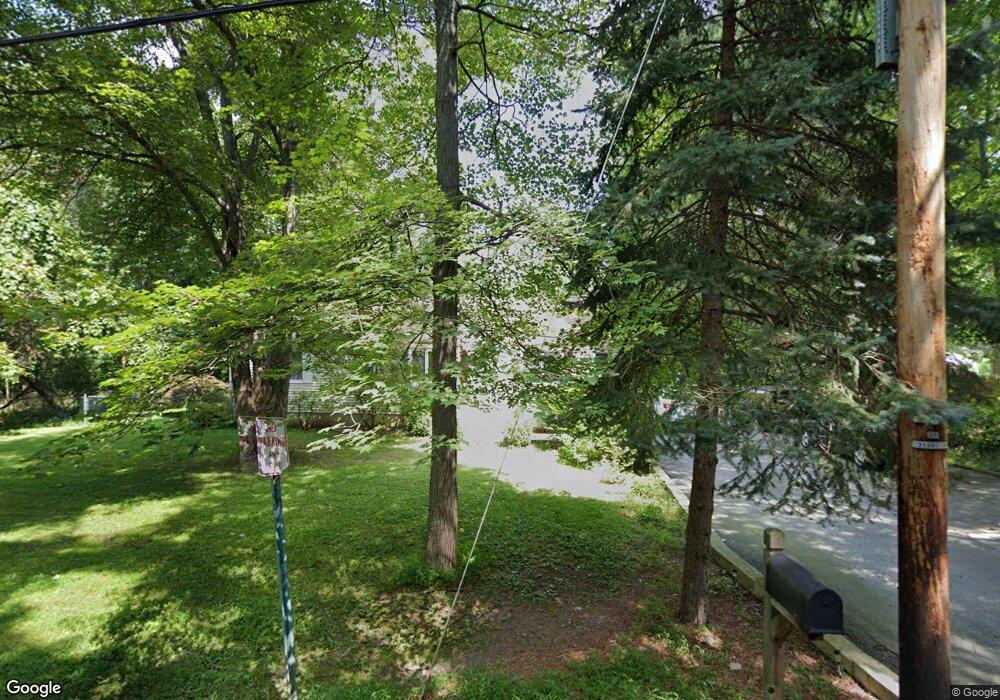
42 Hemlock St Oakland, NJ 07436
Estimated Value: $512,000 - $658,180
3
Beds
2
Baths
1,360
Sq Ft
$439/Sq Ft
Est. Value
About This Home
This home is located at 42 Hemlock St, Oakland, NJ 07436 and is currently estimated at $597,045, approximately $439 per square foot. 42 Hemlock St is a home located in Bergen County with nearby schools including Dogwood Hill Elementary School, Valley Middle School, and Indian Hills High School.
Ownership History
Date
Name
Owned For
Owner Type
Purchase Details
Closed on
May 31, 2024
Sold by
Matarazzo Paul and Matarazzo Natalie
Bought by
Carannante Michael Thomas and Spagnuolo Alyssa Nicole
Current Estimated Value
Home Financials for this Owner
Home Financials are based on the most recent Mortgage that was taken out on this home.
Original Mortgage
$483,300
Outstanding Balance
$477,365
Interest Rate
7.22%
Mortgage Type
New Conventional
Estimated Equity
$119,680
Create a Home Valuation Report for This Property
The Home Valuation Report is an in-depth analysis detailing your home's value as well as a comparison with similar homes in the area
Home Values in the Area
Average Home Value in this Area
Purchase History
| Date | Buyer | Sale Price | Title Company |
|---|---|---|---|
| Carannante Michael Thomas | $537,000 | Foundation Title | |
| Carannante Michael Thomas | $537,000 | Foundation Title |
Source: Public Records
Mortgage History
| Date | Status | Borrower | Loan Amount |
|---|---|---|---|
| Open | Carannante Michael Thomas | $483,300 | |
| Closed | Carannante Michael Thomas | $483,300 |
Source: Public Records
Tax History Compared to Growth
Tax History
| Year | Tax Paid | Tax Assessment Tax Assessment Total Assessment is a certain percentage of the fair market value that is determined by local assessors to be the total taxable value of land and additions on the property. | Land | Improvement |
|---|---|---|---|---|
| 2025 | $9,759 | $460,000 | $298,100 | $161,900 |
| 2024 | $9,503 | $424,300 | $271,300 | $153,000 |
| 2023 | $9,163 | $400,300 | $254,600 | $145,700 |
| 2022 | $9,163 | $389,600 | $247,900 | $141,700 |
| 2021 | $9,873 | $321,600 | $207,200 | $114,400 |
| 2020 | $9,645 | $321,600 | $207,200 | $114,400 |
| 2019 | $9,307 | $321,600 | $207,200 | $114,400 |
| 2018 | $9,111 | $321,600 | $207,200 | $114,400 |
| 2017 | $8,992 | $321,600 | $207,200 | $114,400 |
| 2016 | $8,748 | $321,600 | $207,200 | $114,400 |
| 2015 | $8,574 | $321,600 | $207,200 | $114,400 |
| 2014 | $8,397 | $321,600 | $207,200 | $114,400 |
Source: Public Records
Map
Nearby Homes