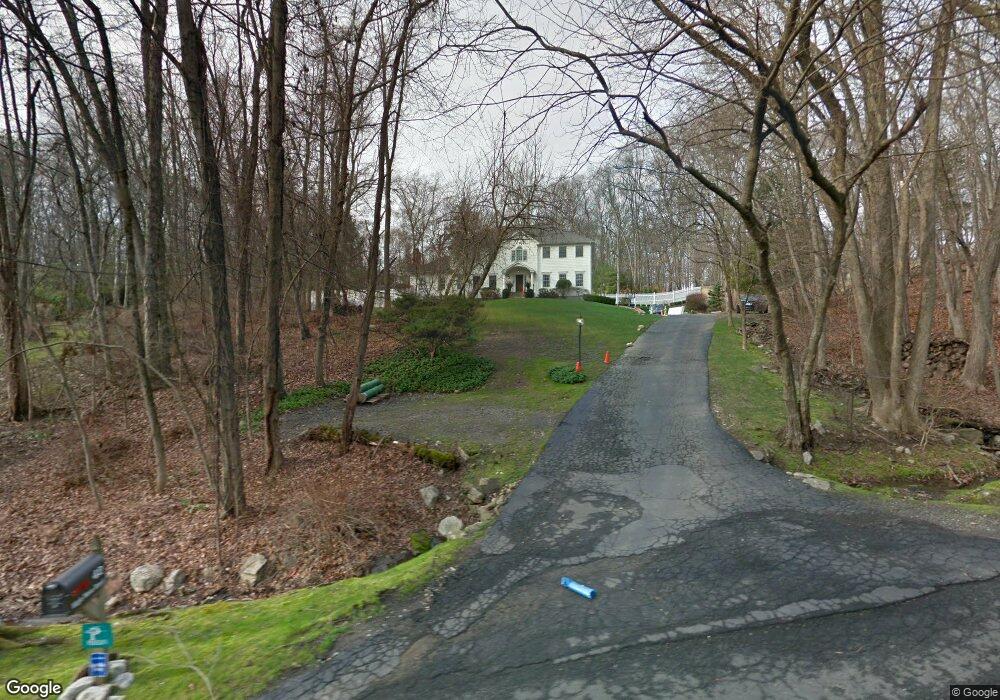
42 High Noon Rd Weston, CT 06883
Estimated Value: $1,266,000 - $1,970,000
4
Beds
3
Baths
4,124
Sq Ft
$381/Sq Ft
Est. Value
About This Home
This home is located at 42 High Noon Rd, Weston, CT 06883 and is currently estimated at $1,570,899, approximately $380 per square foot. 42 High Noon Rd is a home located in Fairfield County with nearby schools including Hurlbutt Elementary School, Weston Intermediate School, and Weston Middle School.
Ownership History
Date
Name
Owned For
Owner Type
Purchase Details
Closed on
Dec 30, 2002
Sold by
Crosby Tammy J and Crosby Philip D
Bought by
Glick Cory I and Glick Rachelle L
Current Estimated Value
Home Financials for this Owner
Home Financials are based on the most recent Mortgage that was taken out on this home.
Original Mortgage
$750,000
Interest Rate
5.12%
Purchase Details
Closed on
Nov 2, 1998
Sold by
Miller Bruce and Miller Karen
Bought by
Crosby Philip and Crosby Tammy
Purchase Details
Closed on
Aug 28, 1997
Sold by
Snyder Kenneth and Happe Susan
Bought by
Miller Bruce and Miller Karen
Purchase Details
Closed on
Aug 30, 1988
Sold by
Dinardo Frank
Bought by
Snyder Kenneth
Purchase Details
Closed on
Apr 19, 1988
Sold by
Hollenberg George
Bought by
Dinardo Frank
Create a Home Valuation Report for This Property
The Home Valuation Report is an in-depth analysis detailing your home's value as well as a comparison with similar homes in the area
Home Values in the Area
Average Home Value in this Area
Purchase History
| Date | Buyer | Sale Price | Title Company |
|---|---|---|---|
| Glick Cory I | $1,090,000 | -- | |
| Crosby Philip | $295,000 | -- | |
| Miller Bruce | $310,000 | -- | |
| Snyder Kenneth | $310,000 | -- | |
| Dinardo Frank | $350,000 | -- |
Source: Public Records
Mortgage History
| Date | Status | Borrower | Loan Amount |
|---|---|---|---|
| Open | Dinardo Frank | $865,500 | |
| Closed | Dinardo Frank | $750,000 | |
| Previous Owner | Dinardo Frank | $490,000 |
Source: Public Records
Tax History
| Year | Tax Paid | Tax Assessment Tax Assessment Total Assessment is a certain percentage of the fair market value that is determined by local assessors to be the total taxable value of land and additions on the property. | Land | Improvement |
|---|---|---|---|---|
| 2025 | $22,771 | $952,770 | $222,040 | $730,730 |
| 2024 | $22,362 | $952,770 | $222,040 | $730,730 |
| 2023 | $21,510 | $650,640 | $222,050 | $428,590 |
| 2022 | $21,452 | $650,640 | $222,050 | $428,590 |
| 2021 | $21,419 | $650,640 | $222,050 | $428,590 |
| 2020 | $21,061 | $650,640 | $222,050 | $428,590 |
| 2019 | $21,061 | $650,640 | $222,050 | $428,590 |
| 2018 | $20,664 | $703,100 | $243,000 | $460,100 |
| 2017 | $20,327 | $703,100 | $243,000 | $460,100 |
| 2016 | $20,081 | $703,100 | $243,000 | $460,100 |
| 2015 | $19,045 | $664,300 | $243,000 | $421,300 |
| 2014 | $18,760 | $664,300 | $243,000 | $421,300 |
Source: Public Records
Map
Nearby Homes
- 14 Codfish Ln
- 10 Pheasant Hill Rd
- 4 Colony Rd
- 274 Lyons Plain Rd
- 85-95 Old Easton Turnpike
- 198 Steep Hill Rd
- 140 Mile Common Rd
- 11 Judges Hollow Rd
- 39 Tannery Ln S
- 1375 Westport Turnpike
- 214 Good Hill Rd
- 200 Long Meadow Rd
- 180 Catamount Rd
- 76 Lords Hwy
- 1 Greenlea Ln
- 158 Coventry Ln
- 30 Lords Hwy
- 22 Brett Rd
- 4800 Congress St
- 319 Bayberry Ln
- 38 High Noon Rd
- 48 High Noon Rd
- 43 High Noon Rd
- 30 High Noon Rd
- 13 Fall Ridge Rd
- 11 Fall Ridge Rd
- 1 Humble Ln
- 35 High Noon Rd
- 9 Fall Ridge Rd
- 44 Codfish Ln
- 54 High Noon Rd
- 45 Codfish Ln
- 1 Ballymoss
- 10 Autumn Ridge Rd
- 27 High Noon Rd
- 4 Humble Ln
- 8 Autumn Ridge Rd
- 53 High Noon Rd
- 58 High Noon Rd
- 9 Autumn Ridge Rd
Your Personal Tour Guide
Ask me questions while you tour the home.