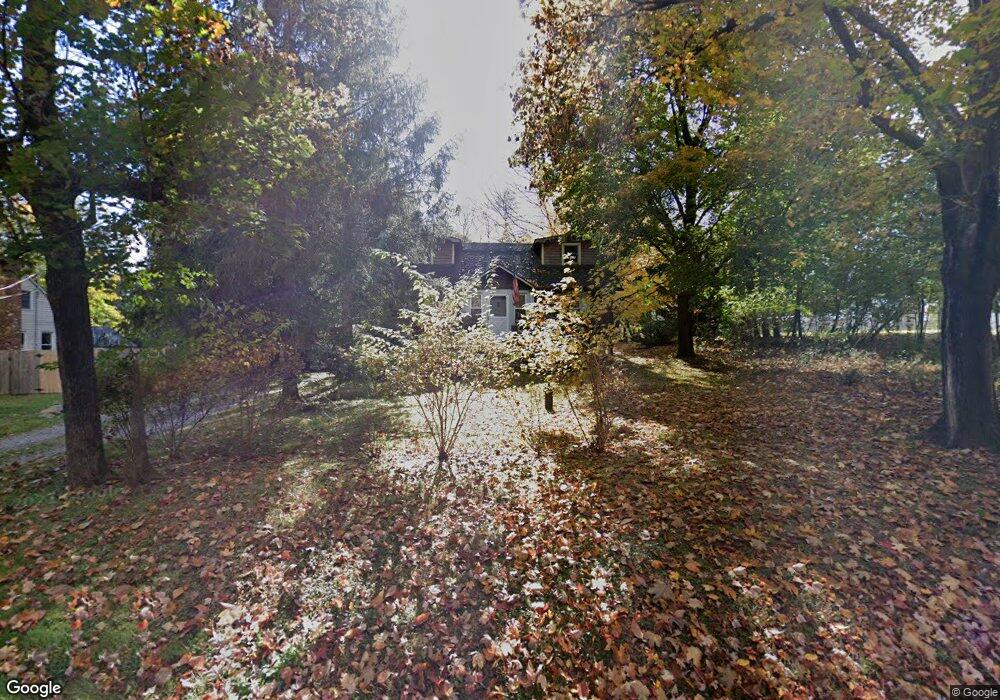
42 Ironia Rd Randolph, NJ 07869
Estimated Value: $465,427 - $695,000
--
Bed
--
Bath
1,849
Sq Ft
$311/Sq Ft
Est. Value
About This Home
This home is located at 42 Ironia Rd, Randolph, NJ 07869 and is currently estimated at $575,607, approximately $311 per square foot. 42 Ironia Rd is a home located in Morris County with nearby schools including Dickerson School, Bragg School, and Black River Middle School.
Ownership History
Date
Name
Owned For
Owner Type
Purchase Details
Closed on
Jun 14, 1999
Sold by
Lautenberg Joel and Lautenberg Maxine Lindig
Bought by
Roman Susan Quiles
Current Estimated Value
Home Financials for this Owner
Home Financials are based on the most recent Mortgage that was taken out on this home.
Original Mortgage
$164,000
Outstanding Balance
$43,395
Interest Rate
7.09%
Mortgage Type
Purchase Money Mortgage
Estimated Equity
$532,212
Create a Home Valuation Report for This Property
The Home Valuation Report is an in-depth analysis detailing your home's value as well as a comparison with similar homes in the area
Home Values in the Area
Average Home Value in this Area
Purchase History
| Date | Buyer | Sale Price | Title Company |
|---|---|---|---|
| Roman Susan Quiles | $205,000 | -- |
Source: Public Records
Mortgage History
| Date | Status | Borrower | Loan Amount |
|---|---|---|---|
| Open | Roman Susan Quiles | $164,000 |
Source: Public Records
Tax History Compared to Growth
Tax History
| Year | Tax Paid | Tax Assessment Tax Assessment Total Assessment is a certain percentage of the fair market value that is determined by local assessors to be the total taxable value of land and additions on the property. | Land | Improvement |
|---|---|---|---|---|
| 2025 | $6,189 | $238,600 | $100,900 | $137,700 |
| 2024 | $6,049 | $238,600 | $100,900 | $137,700 |
| 2023 | $6,049 | $238,600 | $100,900 | $137,700 |
| 2022 | $5,481 | $238,600 | $100,900 | $137,700 |
| 2021 | $5,481 | $238,600 | $100,900 | $137,700 |
| 2020 | $5,662 | $238,600 | $100,900 | $137,700 |
| 2019 | $5,636 | $238,600 | $100,900 | $137,700 |
| 2018 | $5,586 | $238,600 | $100,900 | $137,700 |
| 2017 | $5,564 | $238,600 | $100,900 | $137,700 |
| 2016 | $5,536 | $238,600 | $100,900 | $137,700 |
| 2015 | $5,466 | $238,600 | $100,900 | $137,700 |
| 2014 | $5,476 | $238,600 | $100,900 | $137,700 |
Source: Public Records
Map
Nearby Homes