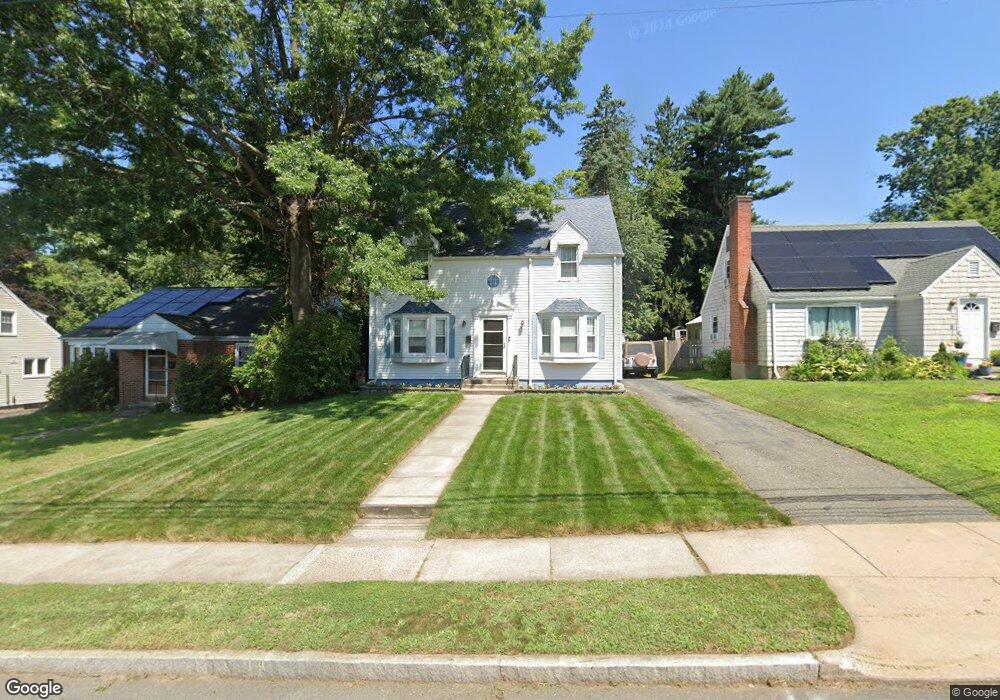
42 Jackson Ave West Hartford, CT 06110
Estimated Value: $350,000 - $369,405
2
Beds
2
Baths
1,404
Sq Ft
$255/Sq Ft
Est. Value
About This Home
This home is located at 42 Jackson Ave, West Hartford, CT 06110 and is currently estimated at $358,351, approximately $255 per square foot. 42 Jackson Ave is a home located in Hartford County with nearby schools including Charter Oak International Academy, Sedgwick Middle School, and Conard High School.
Ownership History
Date
Name
Owned For
Owner Type
Purchase Details
Closed on
Feb 27, 2007
Sold by
Howard Robbin D and Scott Jessica D
Bought by
Soto Elis M
Current Estimated Value
Home Financials for this Owner
Home Financials are based on the most recent Mortgage that was taken out on this home.
Original Mortgage
$213,300
Outstanding Balance
$128,895
Interest Rate
6.23%
Estimated Equity
$229,456
Purchase Details
Closed on
Jul 21, 2000
Sold by
Vieira Francisco J and Vieira Doris M
Bought by
Howard Robbin D and Scott Jessica D
Create a Home Valuation Report for This Property
The Home Valuation Report is an in-depth analysis detailing your home's value as well as a comparison with similar homes in the area
Home Values in the Area
Average Home Value in this Area
Purchase History
| Date | Buyer | Sale Price | Title Company |
|---|---|---|---|
| Soto Elis M | $215,000 | -- | |
| Howard Robbin D | $138,000 | -- |
Source: Public Records
Mortgage History
| Date | Status | Borrower | Loan Amount |
|---|---|---|---|
| Open | Howard Robbin D | $213,300 | |
| Previous Owner | Howard Robbin D | $137,308 |
Source: Public Records
Tax History Compared to Growth
Tax History
| Year | Tax Paid | Tax Assessment Tax Assessment Total Assessment is a certain percentage of the fair market value that is determined by local assessors to be the total taxable value of land and additions on the property. | Land | Improvement |
|---|---|---|---|---|
| 2025 | $7,746 | $172,970 | $60,690 | $112,280 |
| 2024 | $7,325 | $172,970 | $60,690 | $112,280 |
| 2023 | $7,078 | $172,970 | $60,690 | $112,280 |
| 2022 | $7,036 | $172,970 | $60,690 | $112,280 |
| 2021 | $6,277 | $147,980 | $47,320 | $100,660 |
| 2020 | $5,697 | $136,290 | $44,310 | $91,980 |
| 2019 | $5,697 | $136,290 | $44,310 | $91,980 |
| 2018 | $5,588 | $136,290 | $44,310 | $91,980 |
| 2017 | $5,593 | $136,290 | $44,310 | $91,980 |
| 2016 | $5,855 | $148,190 | $49,840 | $98,350 |
| 2015 | $5,677 | $148,190 | $49,840 | $98,350 |
| 2014 | $5,538 | $148,190 | $49,840 | $98,350 |
Source: Public Records
Map
Nearby Homes
- 394 Trout Brook Dr
- 101 Englewood Ave
- 61 Woodmere Rd
- 741 Quaker Ln S
- 69 Saint Augustine St
- 17 Parkview Rd
- 204 Trout Brook Dr
- 26 Saint Augustine St
- 72 Saint Charles St
- 50 Acadia St
- 99 Caya Ave
- 89 Price Blvd
- 90 Park Place Cir Unit 90
- 49 Park Place Cir Unit 49
- 100 Kane St Unit D10
- 136 Kane St Unit B10
- 39 Cortland St
- 1145 New Britain Ave
- 102 Oakwood Ave Unit B5
- 422 S Main St