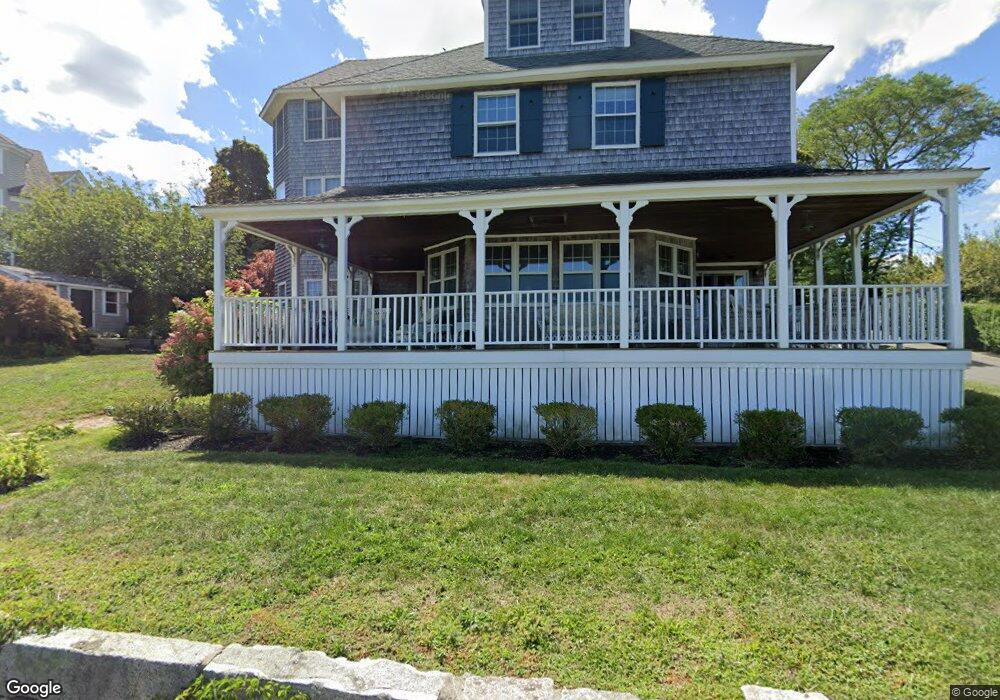
42 Jarvis Ave Hingham, MA 02043
Crow Point NeighborhoodEstimated Value: $2,990,000 - $3,150,433
5
Beds
4
Baths
3,220
Sq Ft
$949/Sq Ft
Est. Value
About This Home
This home is located at 42 Jarvis Ave, Hingham, MA 02043 and is currently estimated at $3,056,144, approximately $949 per square foot. 42 Jarvis Ave is a home located in Plymouth County with nearby schools including William L. Foster Elementary School, Hingham Middle School, and Hingham High School.
Ownership History
Date
Name
Owned For
Owner Type
Purchase Details
Closed on
May 17, 1999
Sold by
Murray Charles J and Murray Carol A
Bought by
Bonn Nicholas and Bonn Susan
Current Estimated Value
Home Financials for this Owner
Home Financials are based on the most recent Mortgage that was taken out on this home.
Original Mortgage
$150,000
Outstanding Balance
$38,372
Interest Rate
6.92%
Mortgage Type
Purchase Money Mortgage
Estimated Equity
$3,017,772
Create a Home Valuation Report for This Property
The Home Valuation Report is an in-depth analysis detailing your home's value as well as a comparison with similar homes in the area
Home Values in the Area
Average Home Value in this Area
Purchase History
| Date | Buyer | Sale Price | Title Company |
|---|---|---|---|
| Bonn Nicholas | $575,000 | -- |
Source: Public Records
Mortgage History
| Date | Status | Borrower | Loan Amount |
|---|---|---|---|
| Open | Bonn Nicholas | $150,000 | |
| Previous Owner | Bonn Nicholas | $75,000 |
Source: Public Records
Tax History
| Year | Tax Paid | Tax Assessment Tax Assessment Total Assessment is a certain percentage of the fair market value that is determined by local assessors to be the total taxable value of land and additions on the property. | Land | Improvement |
|---|---|---|---|---|
| 2025 | $28,587 | $2,674,200 | $1,664,200 | $1,010,000 |
| 2024 | $28,770 | $2,651,600 | $1,664,200 | $987,400 |
| 2023 | $27,298 | $2,729,800 | $1,664,200 | $1,065,600 |
| 2022 | $23,437 | $2,027,400 | $1,147,700 | $879,700 |
| 2021 | $22,677 | $1,921,800 | $1,147,700 | $774,100 |
| 2020 | $21,580 | $1,871,600 | $1,147,700 | $723,900 |
| 2019 | $21,950 | $1,858,600 | $1,147,700 | $710,900 |
| 2018 | $1,698 | $1,837,000 | $1,147,700 | $689,300 |
| 2017 | $19,942 | $1,627,900 | $1,105,400 | $522,500 |
| 2016 | $19,566 | $1,566,500 | $1,052,800 | $513,700 |
| 2015 | $19,089 | $1,523,500 | $1,036,200 | $487,300 |
Source: Public Records
Map
Nearby Homes
- 17 Paige St
- 12 Daley Rd
- 16 Foley Beach Rd
- 81 Kimball Beach Rd
- 2 Langlee Rd
- 151 Stayner Dr Unit 151
- 132 Hms Stayner Dr Unit 132
- 43 Park View Dr
- 130 Broad Reach Unit 206
- 23 Shipyard Dr Unit 206
- 64 Broad Reach Unit 107
- 64 Broad Reach Unit 310
- 54 Broad Reach Unit 104
- 51 Broad Reach Unit T23A
- 300 River St Unit 12
- 1 Squirrel Hill Ln
- 225 South St Unit 1
- 112 Martins Ln
- 21 Hersey St
- 6 Adams Ct
Your Personal Tour Guide
Ask me questions while you tour the home.