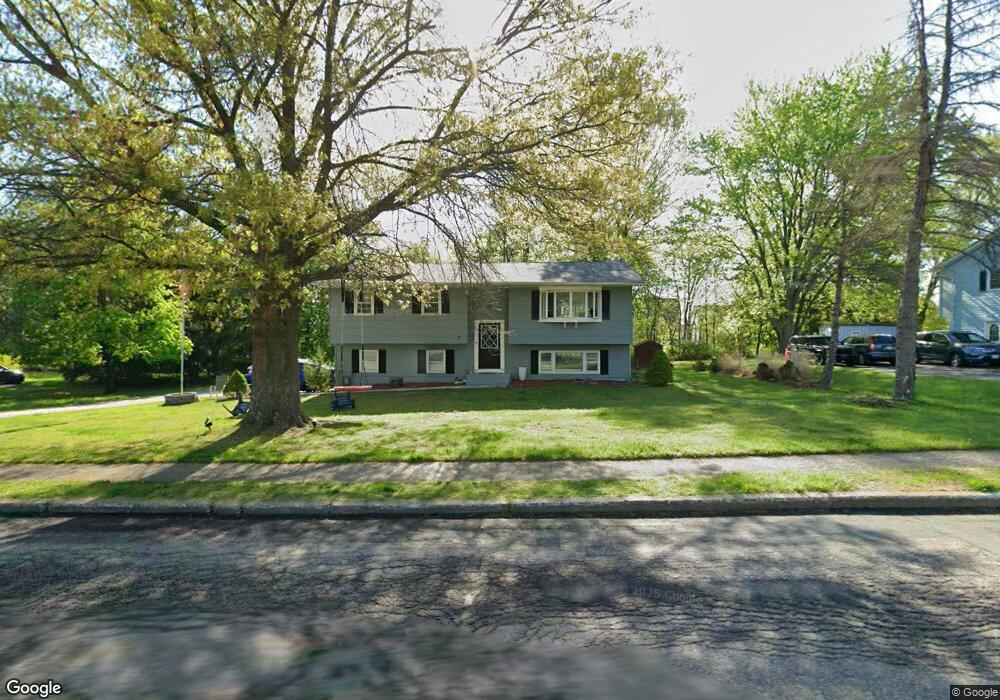
42 Jones Dr Highland Mills, NY 10930
Estimated Value: $491,121 - $568,000
4
Beds
3
Baths
1,893
Sq Ft
$280/Sq Ft
Est. Value
About This Home
This home is located at 42 Jones Dr, Highland Mills, NY 10930 and is currently estimated at $529,280, approximately $279 per square foot. 42 Jones Dr is a home located in Orange County with nearby schools including Monroe-Woodbury Middle School, Monroe-Woodbury High School, and Sheri Torah - V'Yoel Moshe.
Ownership History
Date
Name
Owned For
Owner Type
Purchase Details
Closed on
Sep 14, 2021
Sold by
Finley Karen
Bought by
Davila Daniel V and Williams Tracy
Current Estimated Value
Home Financials for this Owner
Home Financials are based on the most recent Mortgage that was taken out on this home.
Original Mortgage
$361,211
Outstanding Balance
$327,014
Interest Rate
2.8%
Mortgage Type
FHA
Estimated Equity
$202,266
Purchase Details
Closed on
Sep 10, 2004
Sold by
Caruso Anthony P
Bought by
Finley Karen
Create a Home Valuation Report for This Property
The Home Valuation Report is an in-depth analysis detailing your home's value as well as a comparison with similar homes in the area
Home Values in the Area
Average Home Value in this Area
Purchase History
| Date | Buyer | Sale Price | Title Company |
|---|---|---|---|
| Davila Daniel V | $373,000 | None Available | |
| Davila Daniel V | $373,000 | None Available | |
| Davila Daniel V | $373,000 | None Available | |
| Finley Karen | $340,000 | Mary Tuttle |
Source: Public Records
Mortgage History
| Date | Status | Borrower | Loan Amount |
|---|---|---|---|
| Open | Davila Daniel V | $361,211 | |
| Closed | Davila Daniel V | $361,211 |
Source: Public Records
Tax History Compared to Growth
Tax History
| Year | Tax Paid | Tax Assessment Tax Assessment Total Assessment is a certain percentage of the fair market value that is determined by local assessors to be the total taxable value of land and additions on the property. | Land | Improvement |
|---|---|---|---|---|
| 2024 | $11,729 | $119,500 | $23,900 | $95,600 |
| 2023 | $11,729 | $119,500 | $23,900 | $95,600 |
| 2022 | $12,087 | $119,500 | $23,900 | $95,600 |
| 2021 | $11,966 | $119,500 | $23,900 | $95,600 |
| 2020 | $11,211 | $119,500 | $23,900 | $95,600 |
| 2019 | $10,899 | $119,500 | $23,900 | $95,600 |
| 2018 | $10,899 | $119,500 | $23,900 | $95,600 |
| 2017 | $10,611 | $119,500 | $23,900 | $95,600 |
| 2016 | $10,508 | $119,500 | $23,900 | $95,600 |
| 2015 | -- | $119,500 | $23,900 | $95,600 |
| 2014 | -- | $119,500 | $23,900 | $95,600 |
Source: Public Records
Map
Nearby Homes